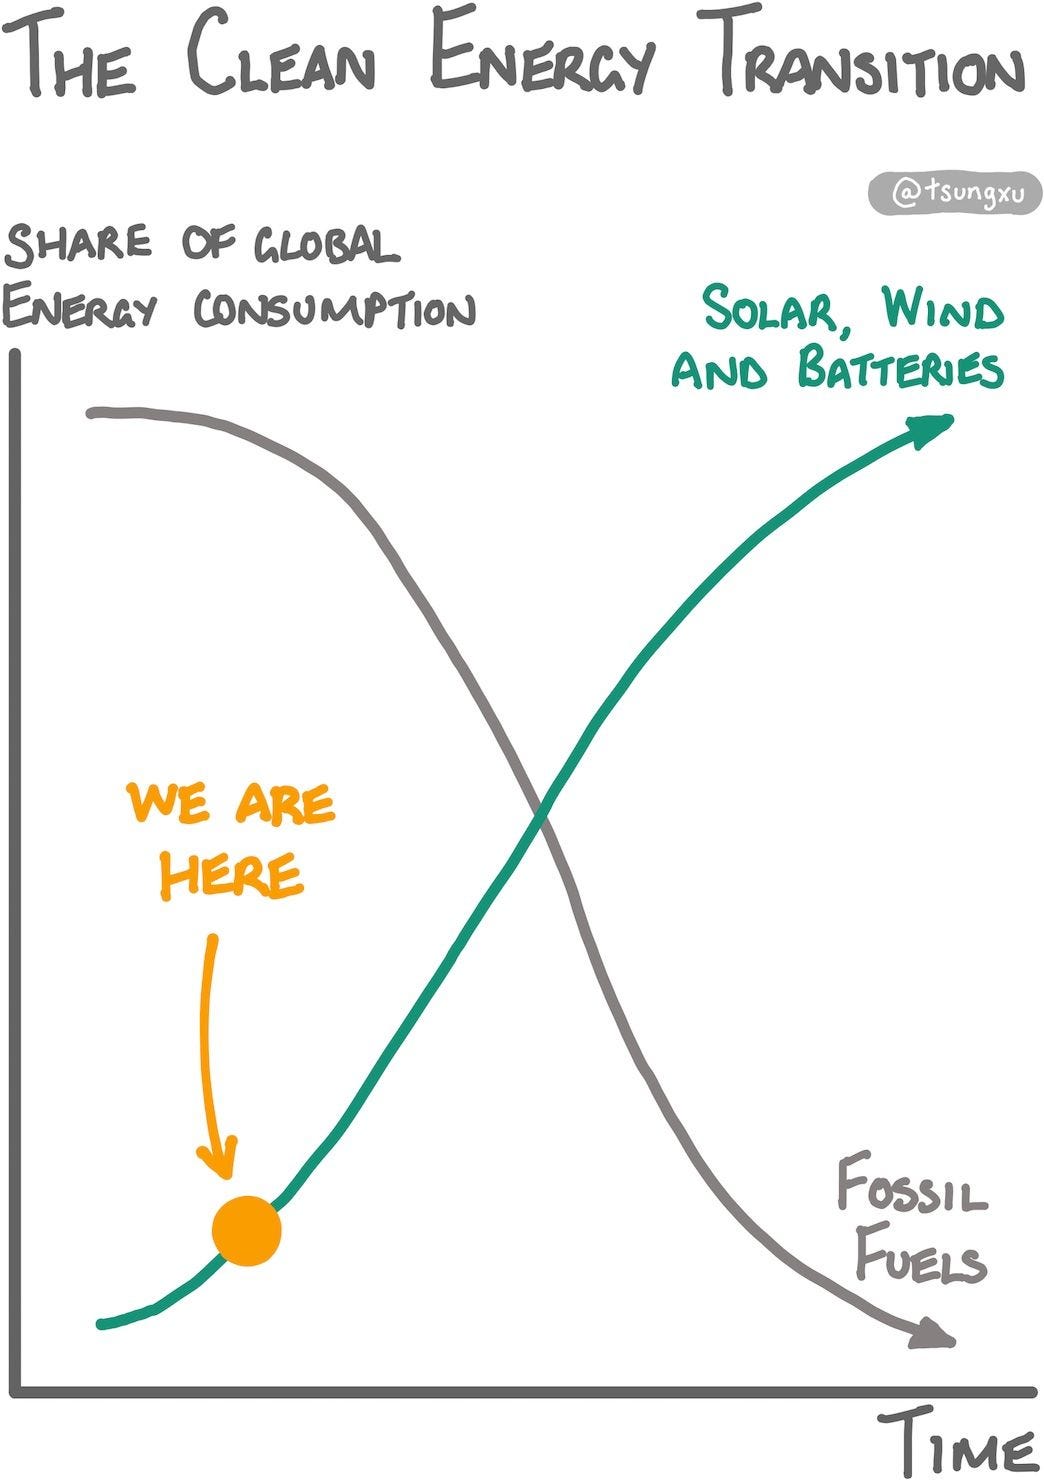
Powered by solar, wind and lithium-ion batteries, the clean energy transition is reshaping the world.
Just over a year ago, I would not have believed that statement.
Back then, I did not appreciate just how fast these changes were multiplying. I have since learned a ton about energy transitions and climate tech, crunched the data and triangulated insights.
Today, I have no doubt about the clean energy transition and the impact it will have on our lives and societies. The phrase energy transition is also an understatement and few people alive have lived through one before to know any different. Looking at history overcomes our collective amnesia to see how important energy transitions have been, and hints at the path we are on now.
This post explains what is driving the transition and explores emerging opportunities. Fairly new to the topic? This could be an overview that helps orient as you learn more. Already playing your role in the transition? You might find a perspective that challenges your thinking or surprises you. You could even be nudged to build or join a company to tap into the energy transition's huge opportunities ahead.
Let's go.
Introduction
The following headline insights are short summaries. In the Key Takeaways section below, we revisit each insight in more detail. In the main sections, we then discuss each point in the most depth.
Insight 1: Plummeting Solar and Battery Costs Are Now At Tipping Points
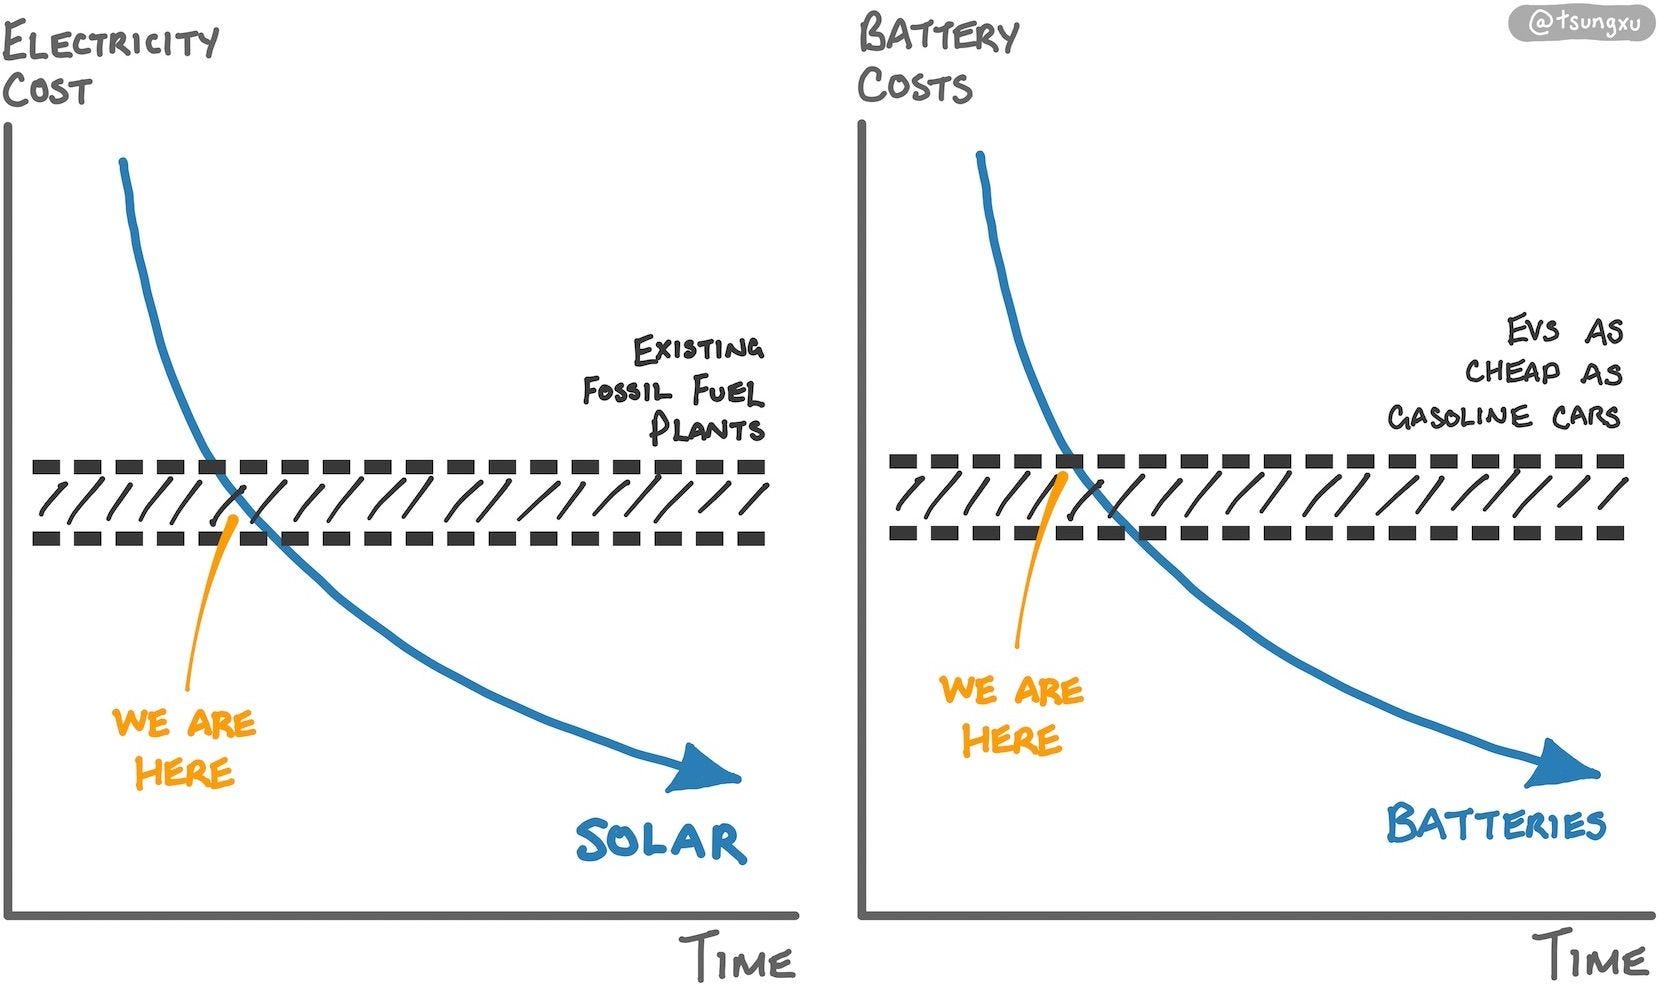
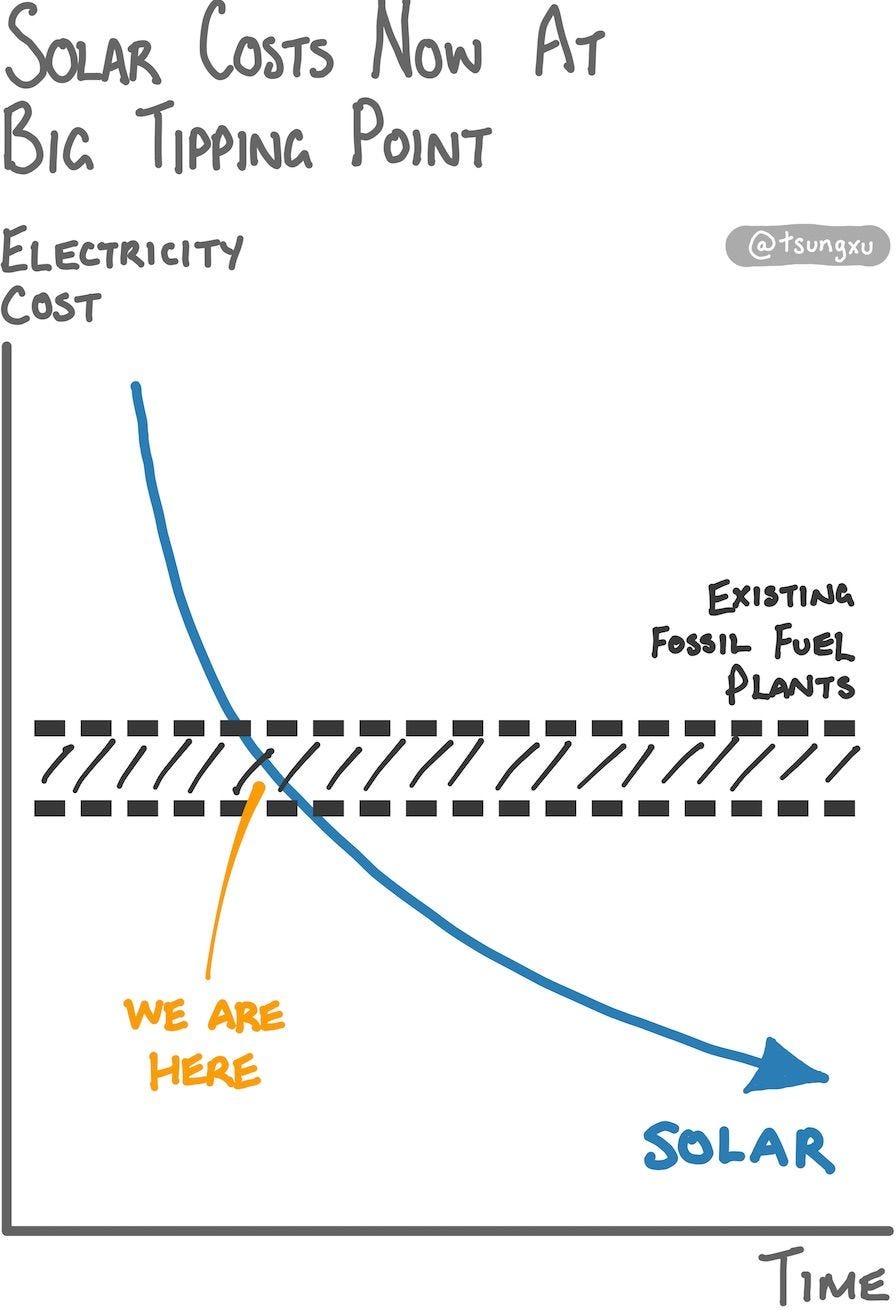
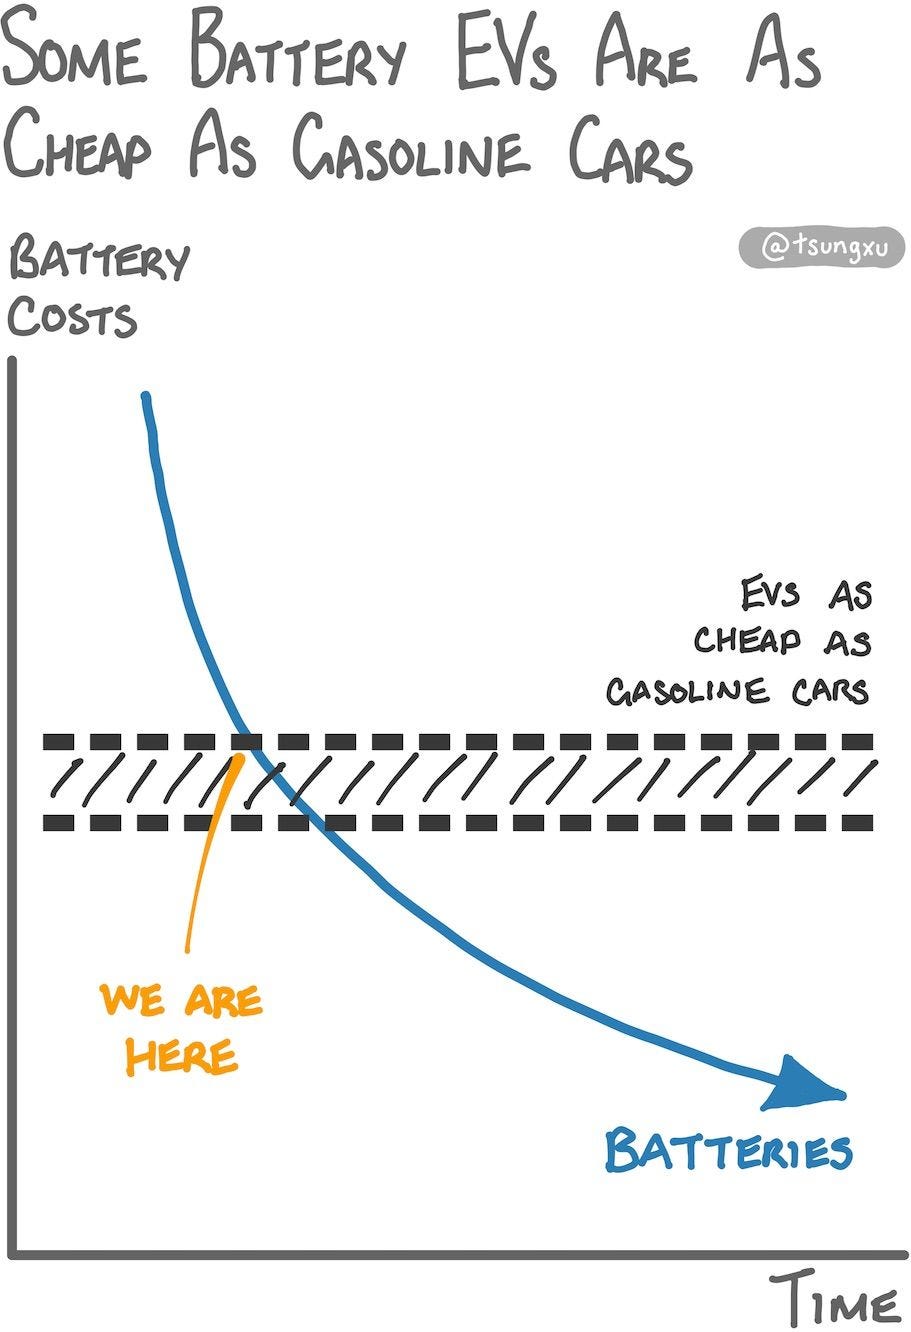
Solar and lithium-ion batteries costs keep falling, and are now at tipping points of sustained and rapid growth, as shown in these charts.
In generating electricity, solar and wind are rapidly rising to replace fossil fuels. In mobility, lithium-ion battery prices have allowed electric vehicle (EVs) costs to be comparable to gas-guzzling cars.
These tipping points are accelerants propelling us towards a clean energy future.
Insight 2: As Production Scales, Solar, Wind and Batteries Become Cheaper and Better
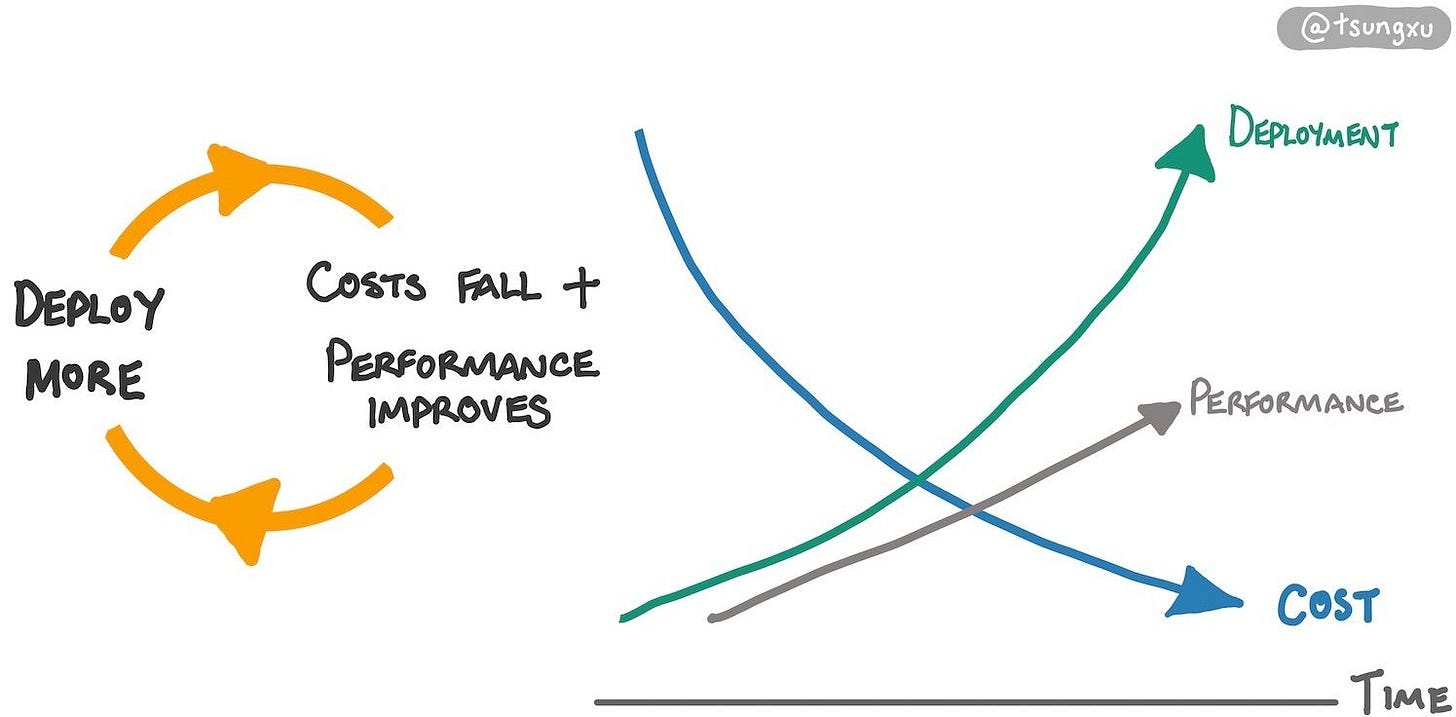
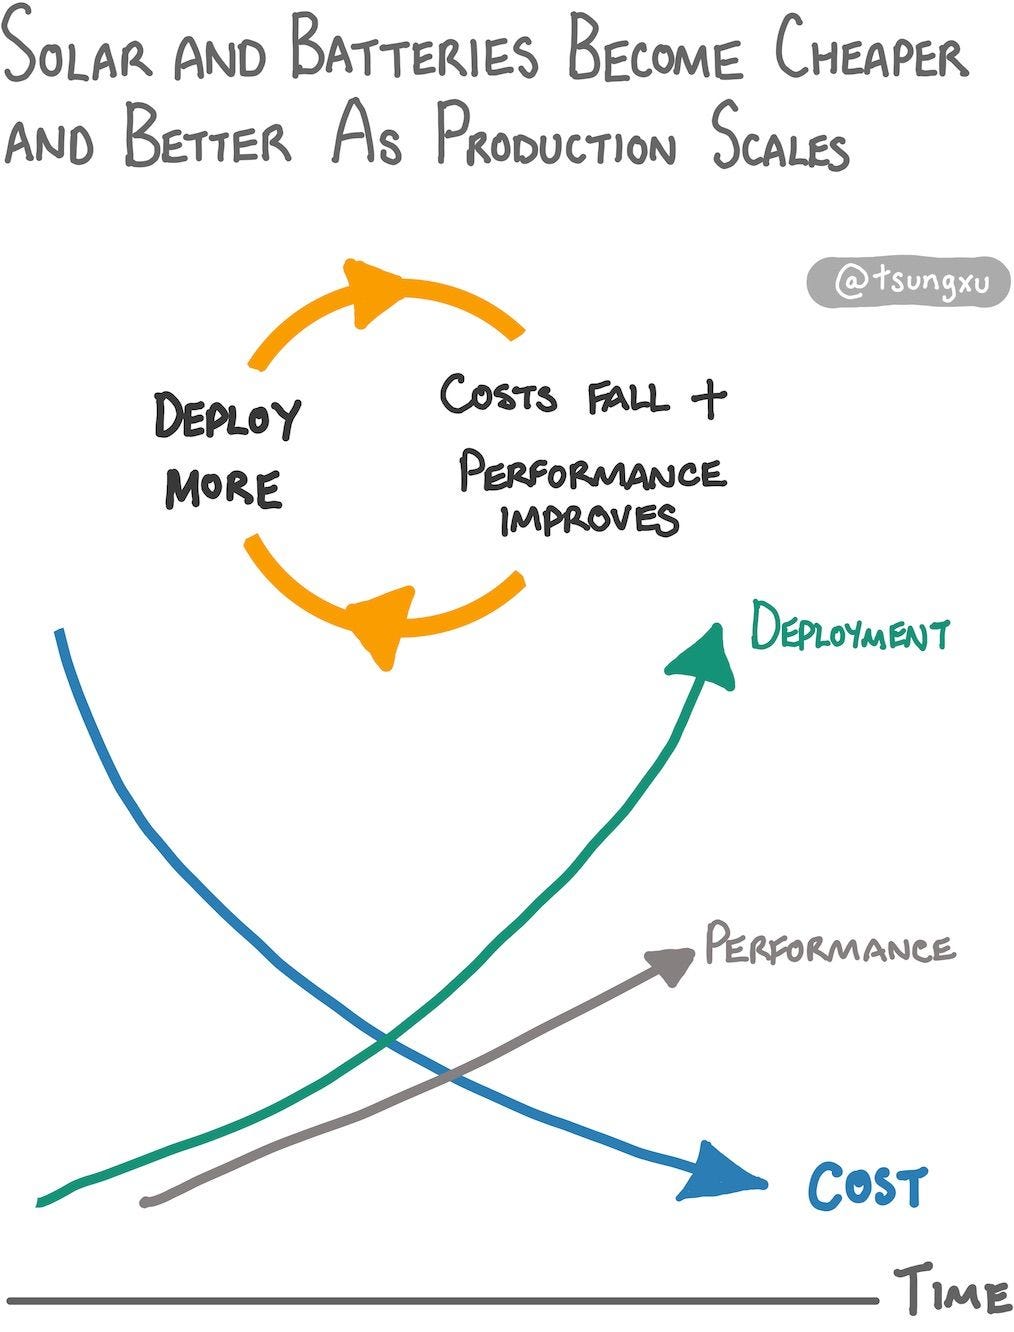
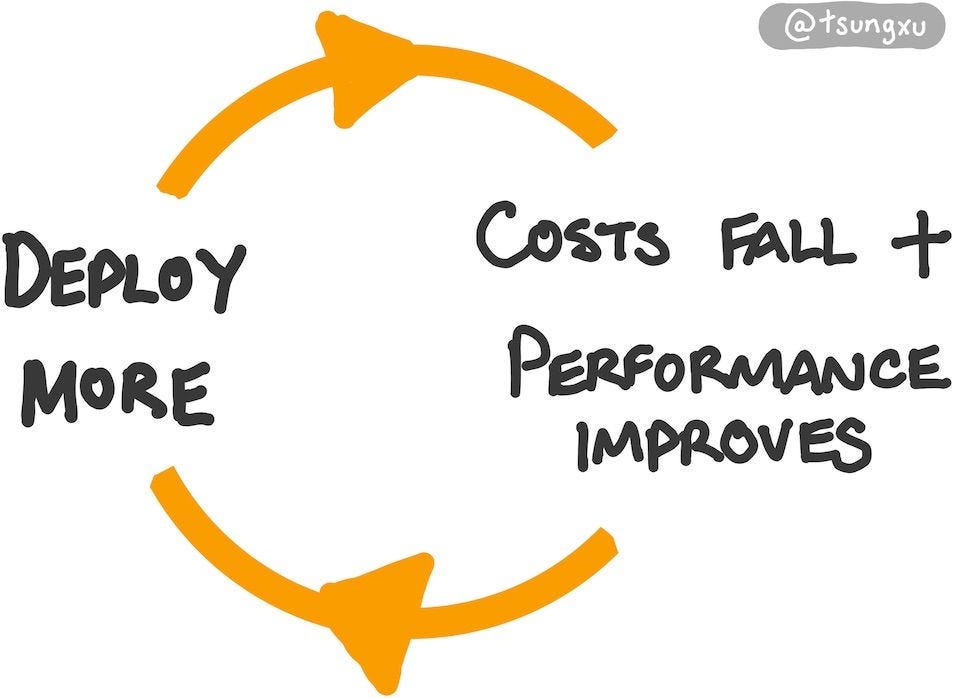
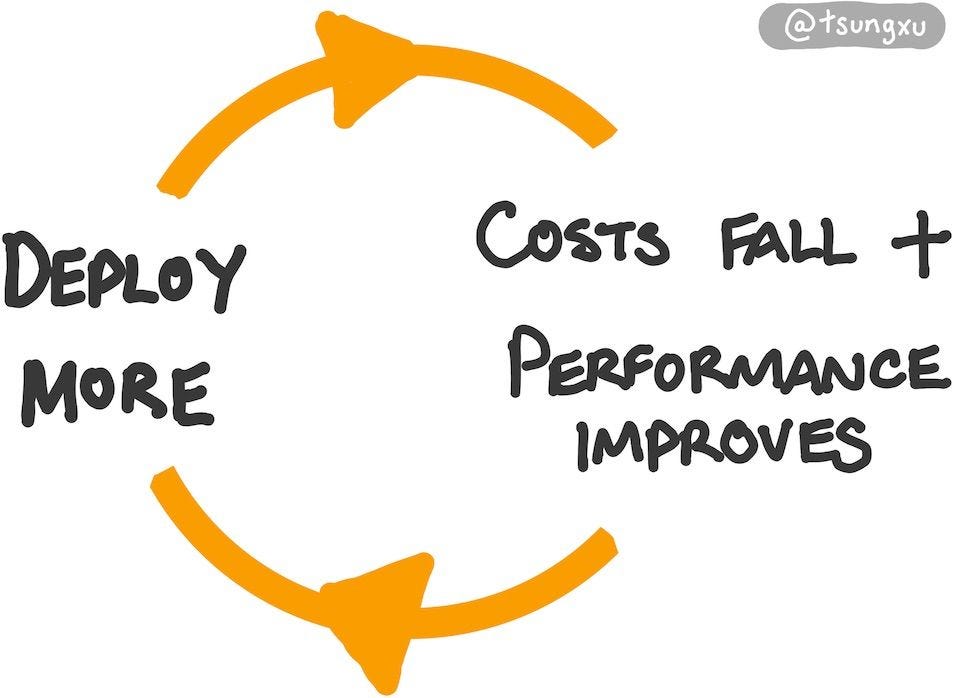
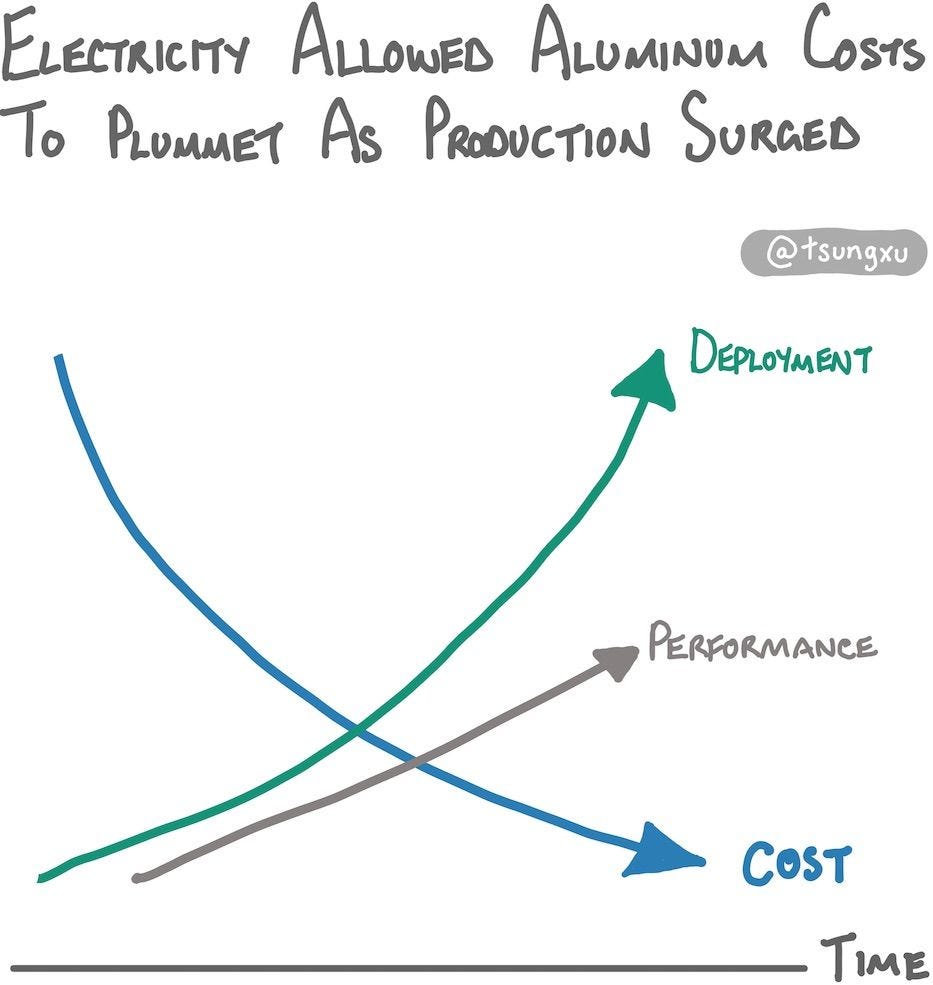
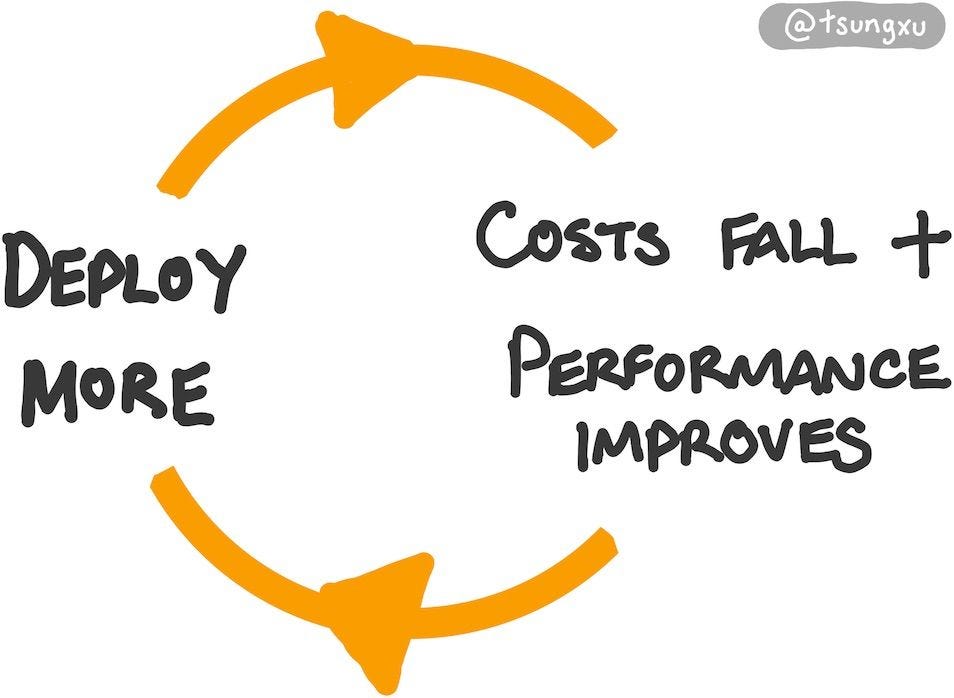
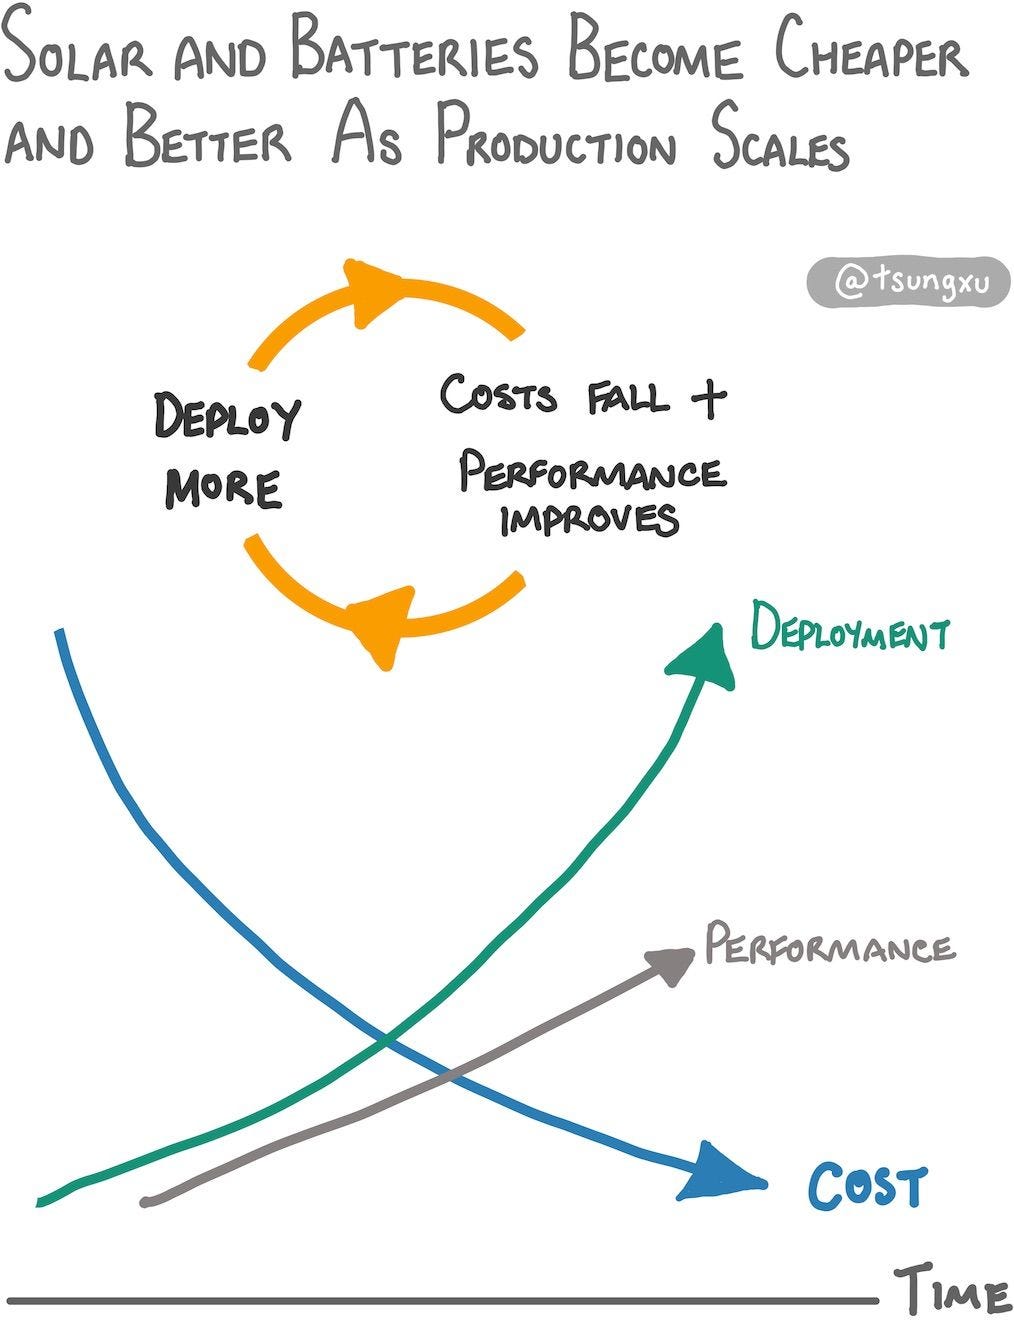
We can manufacture solar panels and wind turbines to generate energy, and batteries to store it. This allows more of these resources to be deployed whilst costs fall and improving performance, shown below.
In previous energy transitions, this self-reinforcing cycle had never been sustained over multiple decades. As a result, predictions about clean energy deployments and costs have been persistently underwhelming.
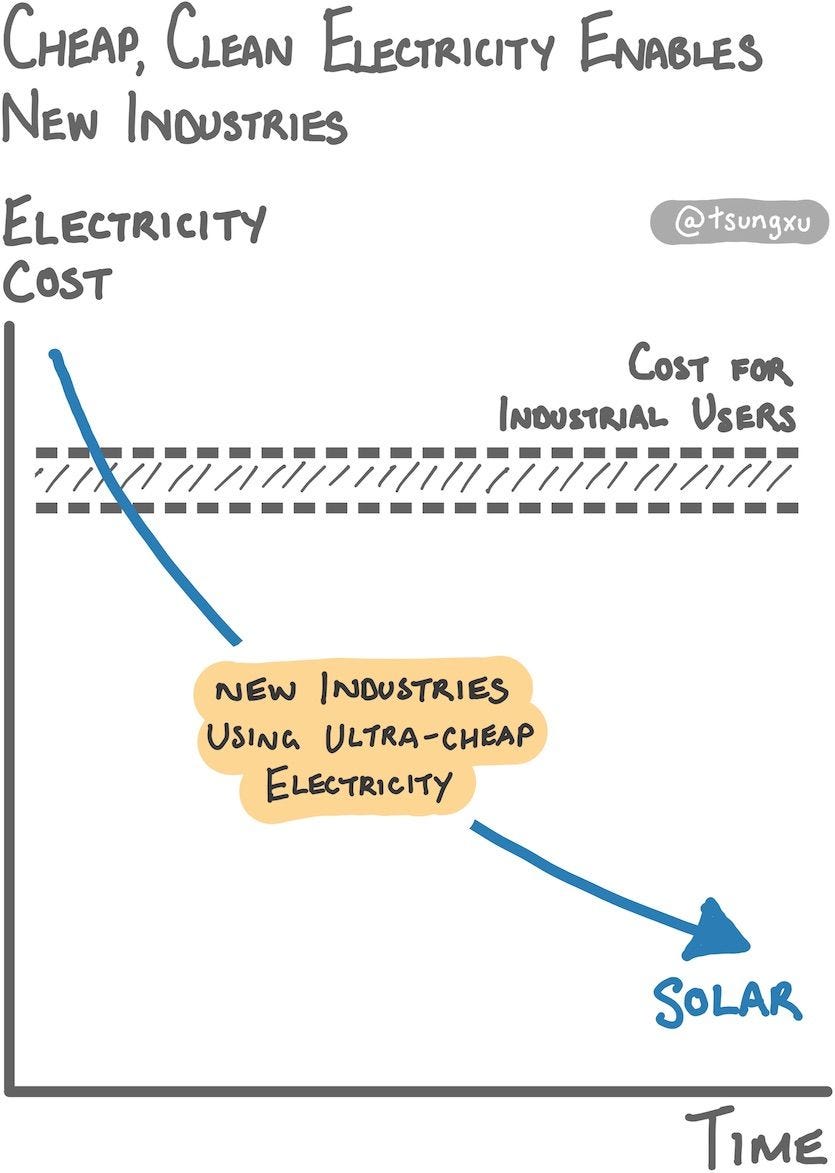
Insight 3: Cheap, Clean Electricity Enables New Industries
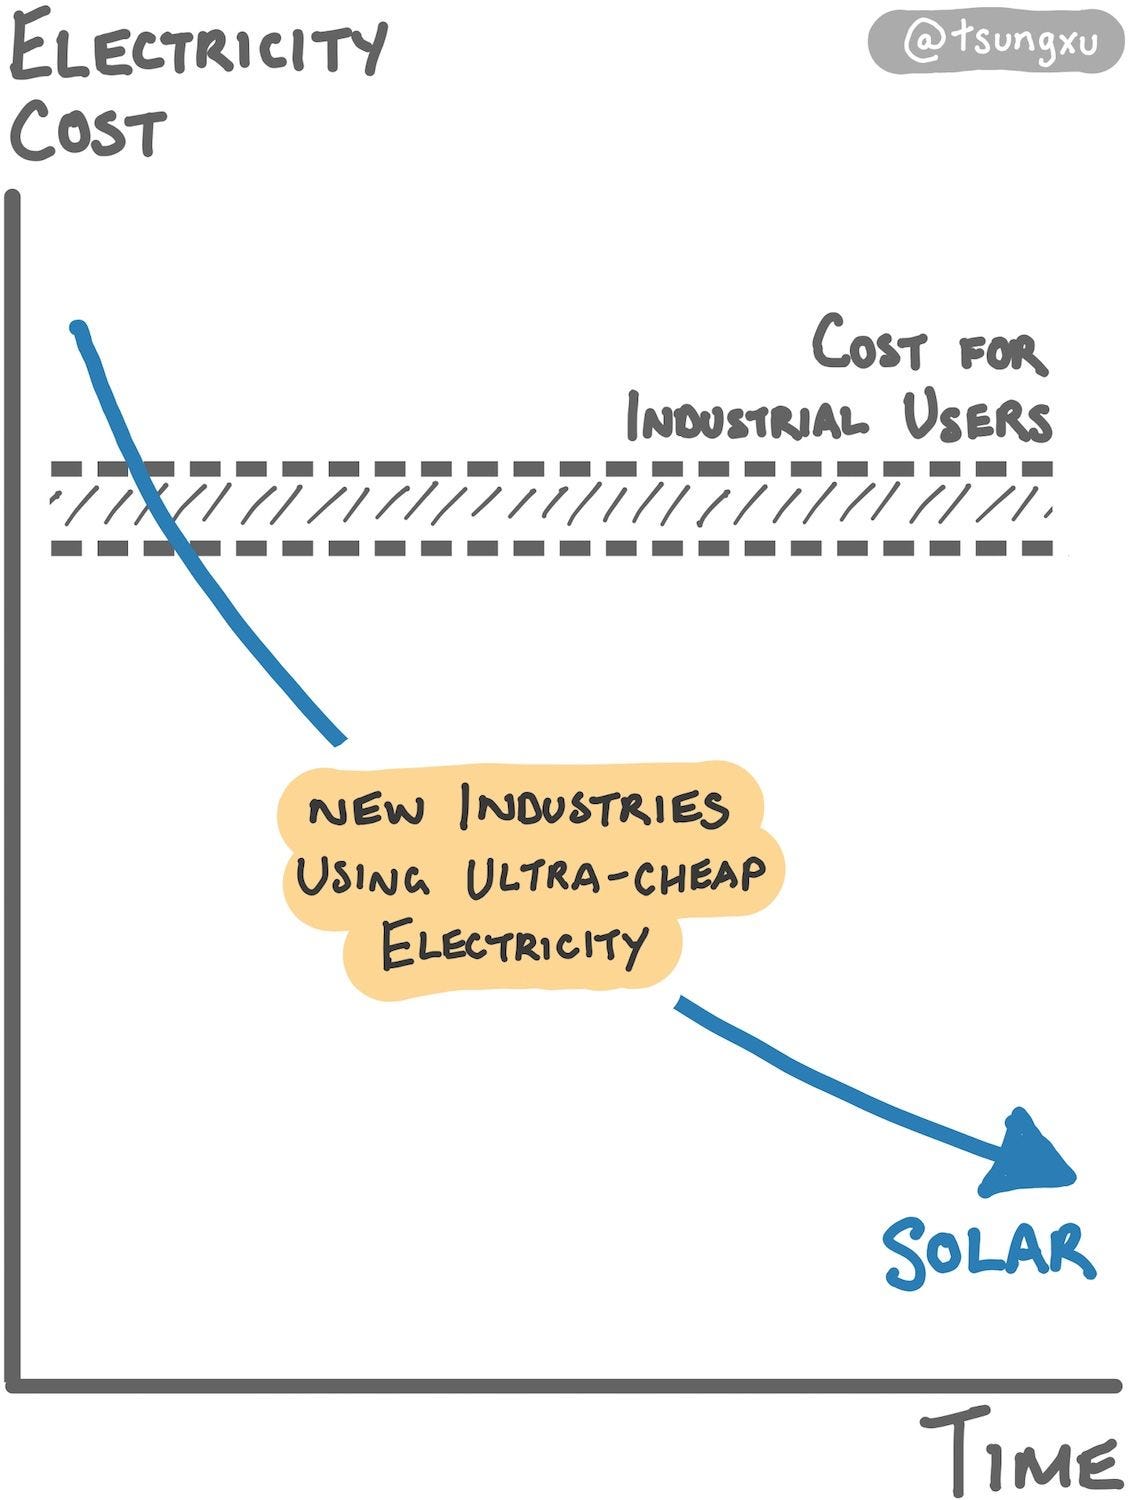
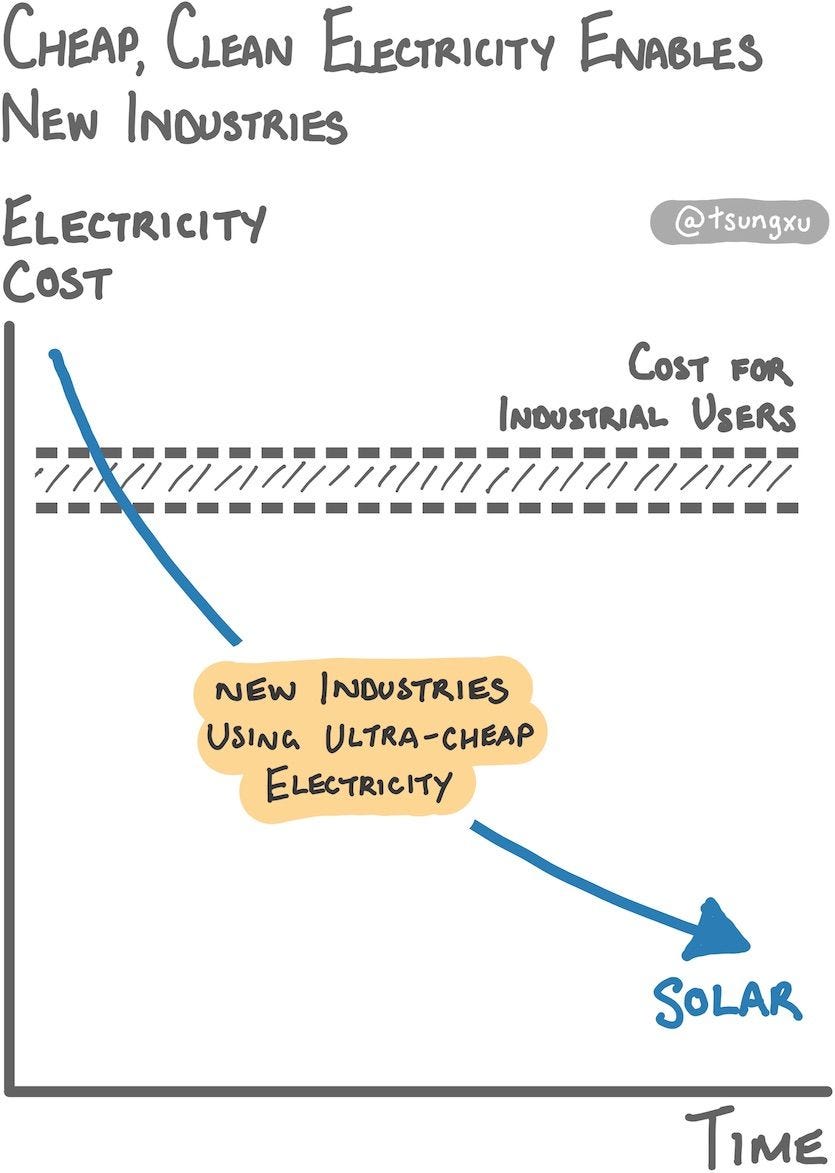
Already historically cheap, the price of electricity from solar and wind will keep falling. Solar will likely drive most of the cost reductions.
Electricity prices are becoming cheap enough for new electrochemical industries to thrive, as shown above. Emerging opportunities include electricity-driven direct air capture, and production of new materials.
We'll see later that entrepreneurs who see the speed of the energy transition are the ones building the future of it.
Insight 4: Emerging Energy Sources Scale Up Through Similar Phases
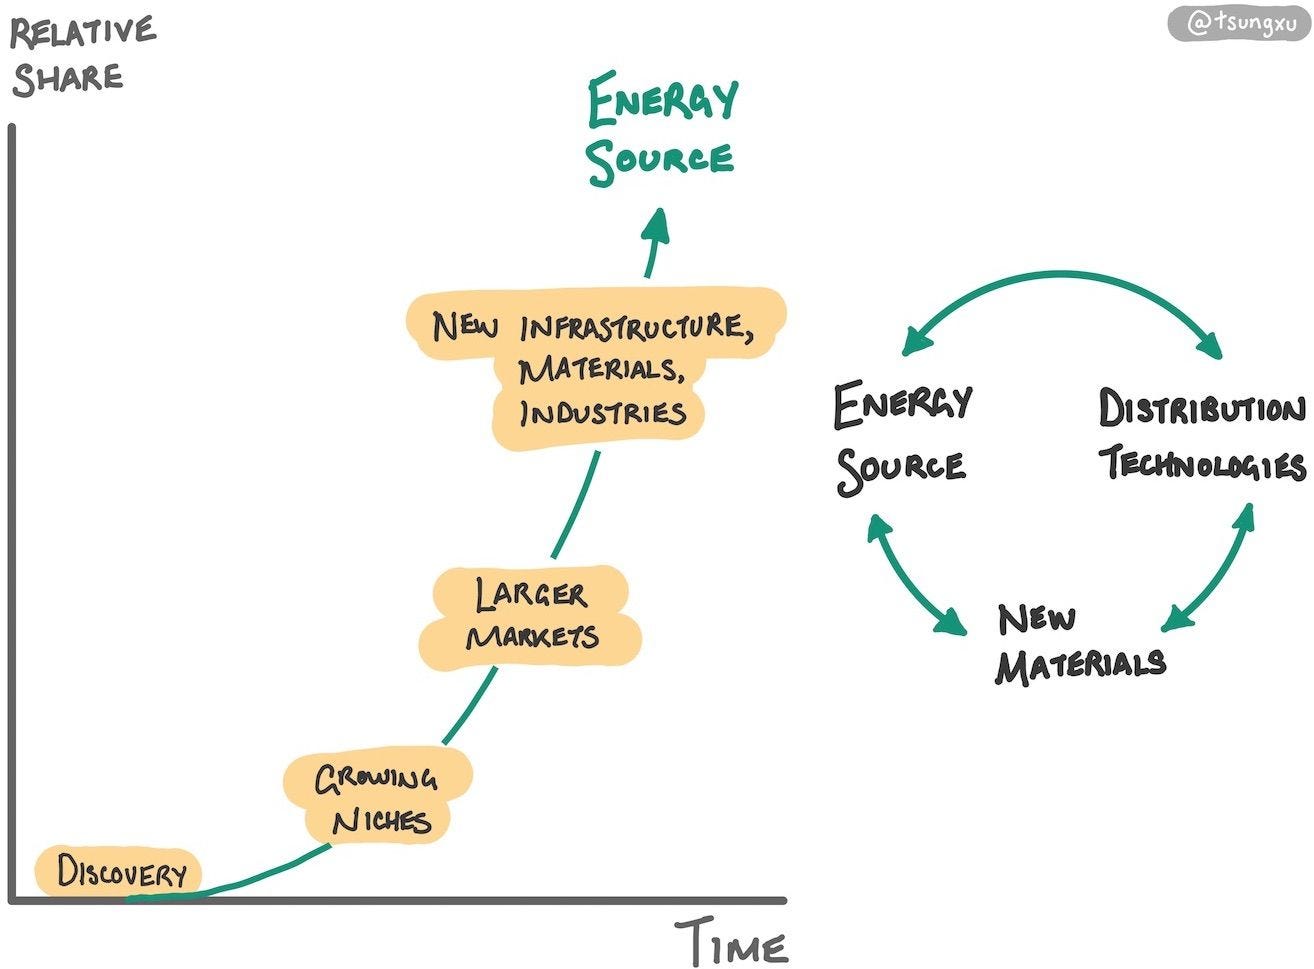
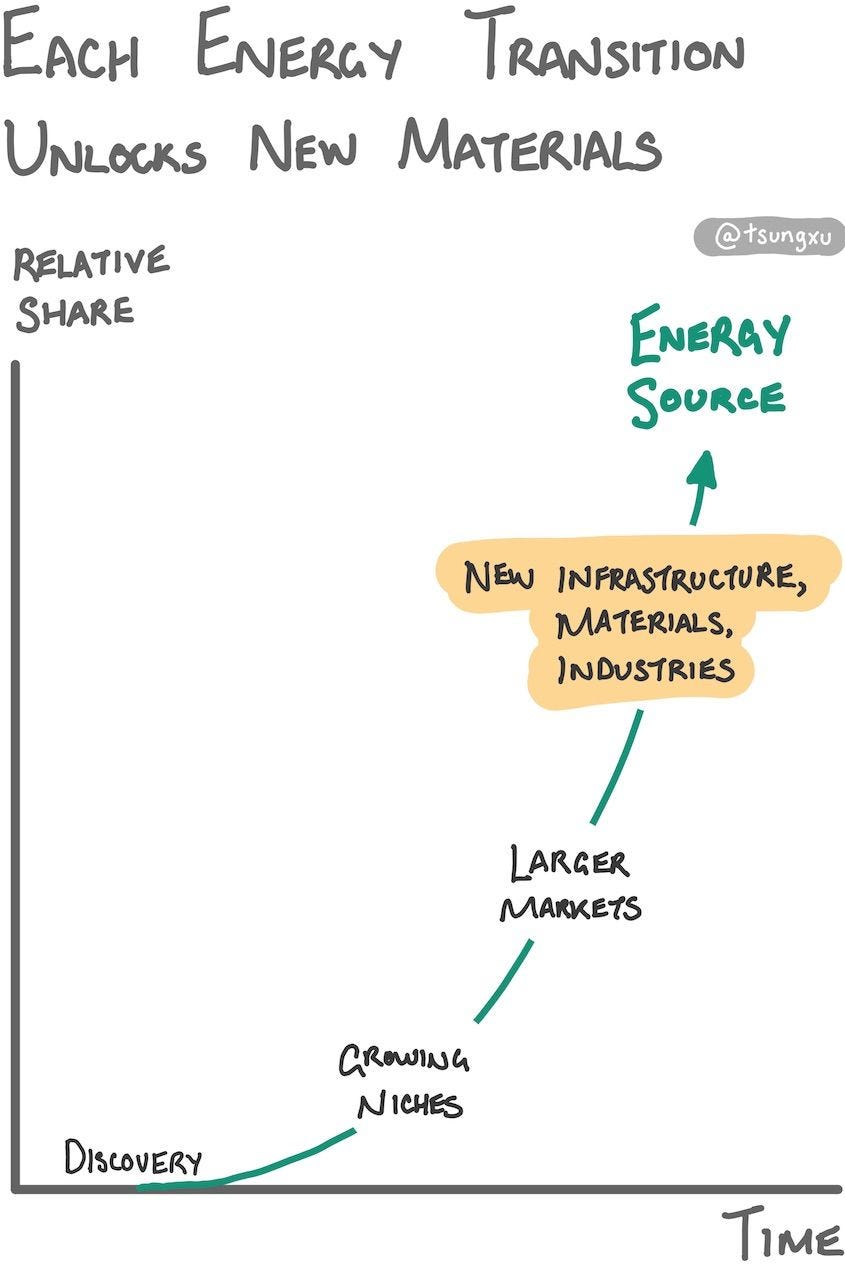
The coal, oil and electricity transitions have scaled up through similar phases, which you can see in the chart below. Today solar, wind and batteries are also scaling up through these phases.
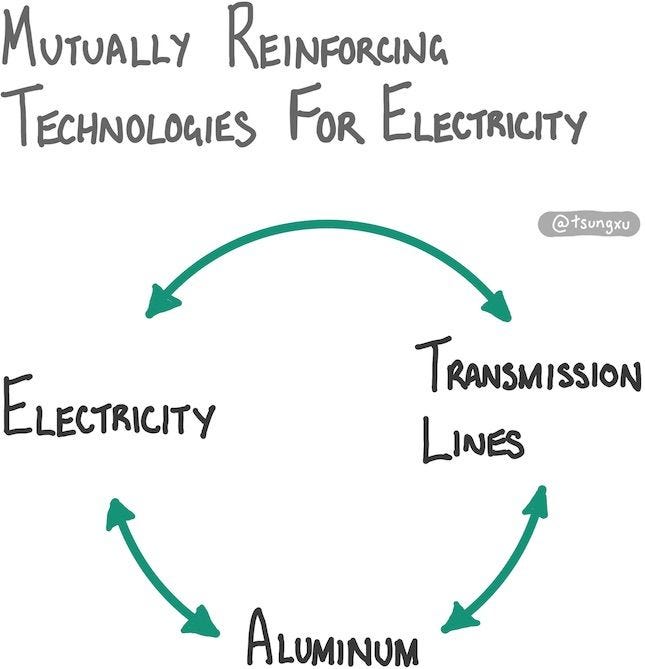
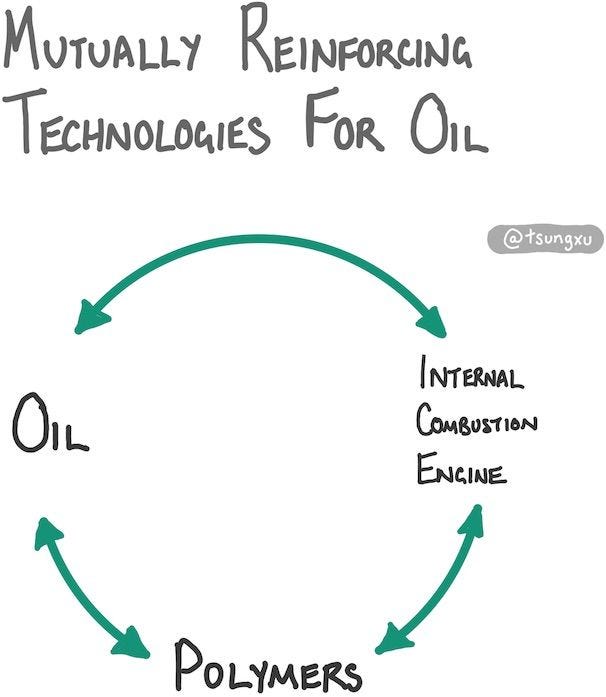
Energy sources have mutually reinforcing feedback loops with other technologies, which help to drive further adoption. For example, the internal combustion engine and petrochemicals drove more demand for oil, allowing it to gain an increasing share of global energy use in the early to mid 20th century.
These feedback loops and phases can help guide how far along we are in the transition and what opportunities are emerging.
How to read this guide
Make no mistake that this is a long read. If you are feeling motivated, just keep reading. There is an overall narrative connecting the sections, but each section is largely self-contained.
If you just want the tl;dr, that would be the key takeaways. Then, you could choose a section to dive into further using the table of contents.
Table of Contents
1) Plummeting Solar and Battery Costs Are Now At Tipping Points
2) As Production Scales, Solar, Wind and Batteries Become Cheaper and Better
1 Patterns in Previous Energy Transitions
1.1 Coal: Steam, Locomotives and Iron
1.2 Oil, Internal Combustion Engines and Polymers
2.1 Solar Adoption: Slow, Then All At Once
2.2 Falling Costs Have Opened Up Larger Markets
2.3 Solar’s Growth Keeps Being Underestimated
3 Storage: Batteries, EVs and More
3.1 LIB Adoption Is Even Faster Than Solar
3.2 EVs Are Rapidly Replacing ICE Cars
3.3 LIB and EV Producers Outpacing Tech Giants’ Growth
3.4 Storage For Grids Is Booming
3.5 Home Energy Storage: Three Approaches
4 As Energy Becomes Even Cheaper…
4.1 Electricity Prices Had Been Stagnant, Until Solar and Wind
4.2 Lowest Prices In Sunbathed and Windy Regions
5 Opportunity: Removing & Using CO2
5.1 Negative Emissions Derisk Climate Scenarios
5.2 Direct Air Capture Is A Promising Approach
5.3 Clean CO2 to “X” May Outcompete Fossil Fuels
5.4 Existing Markets: CO2 As End Product
6 Opportunity: Emerging Materials
6.1 Low-cost Electricity Allowed Aluminum To Scale
8.1 Insanely cheap solar, wind and storage power almost everything
8.2 EVs of all types and are taking over transportation
8.3 Battery storage is everywhere, but in EVs above all
8.4 Most existing industries are electrified, all are low-carbon
Motivations
Energy (and climate) is an incredibly exciting and impactful problem space to be working on.
This space tackles two things in my mind. One is the risks of climate change, where we all should try to avoid the worst outcomes. Two is the continuing progress in energy technology, without which human progress could stagnate.
For over a year, I have been learning about the clean energy transition. I spoke to dozens of clean tech founders and engineers and absorbed books, research reports, papers, podcasts and countless articles.
Two things became clear.
First, solar and lithium-ion battery technologies were the core of the energy transition. Their rapid pace of adoption and dramatic cost reductions was unprecedented for energy technologies.
Second, very few insiders I talked to or learned from seemed to think solar and batteries would be as impactful as I was starting to think.
Was I wrong? I get that there are a plethora of technology, implementation, policy and other problems. Would these put the brakes on the path to a clean, cheap energy future?
As I continued my research, I gathered more data points and conviction that clean energies would be incredibly impactful.
When I was researching, I did not come across an article like this, but it would have really helped me orient myself. I hope this piece can help as a guide for at least a few people who are curious about the transition and where it could be going.
In writing this, I aim to find fellow tinkerers and builders who see the opportunities and may want to discuss and test ideas together.
Why The Clean Energy Transition Is Underestimated
It’s hard for us to fathom what we’ve never lived through. Few people alive today witnessed previous energy transitions happen. This makes it easy to underestimate how impactful they were, and how quickly they tend to happen once in motion. After all, the rise of coal, oil and electricity each happened over one hundred years ago in developed countries.
As almost no one alive had lived through the Spanish Flu one hundred years ago, COVID showed us how short our collective memory usually is for rare events of planetary scale.
It’s easy to think that the rapid scaling of solar, wind and battery technology cannot be sustained. Each transition goes through growing pains. But when there’s insatiable demand, industries find ways to meet it. That was the case for coal, oil and electricity as we’ll see, and it is the case today for cheap, clean energies.
There's the related concern that the decades-long cost reductions for solar and batteries will flatten out. As we'll cover, this is very unlikely. Existing technology and processes will keep improving and new technologies will be commercialized.
It’s hard to think about technologies and change as being non-linear. Let's show this with an example. Suppose you start with one grain of sand. Say that this one grain duplicates every year. How many years would it take for this one grain to replicate into the total number of sand grains on Earth? Assume there's 7.5 billion billion (7.5 x 10^18) grains of sand in the world.
What's your guess? 10,000 years? 1,000? It takes less than 63 years or doublings. If the lone sand grain duplicates every two years (ie grows at 41.4% per year), it only takes twice as long to hit that mark. These examples seem extremely counterintuitive, but it’s hard for people to think in this way. Those with startup experience tend to better grok non-linear thinking, as initial traction and growth are everything.
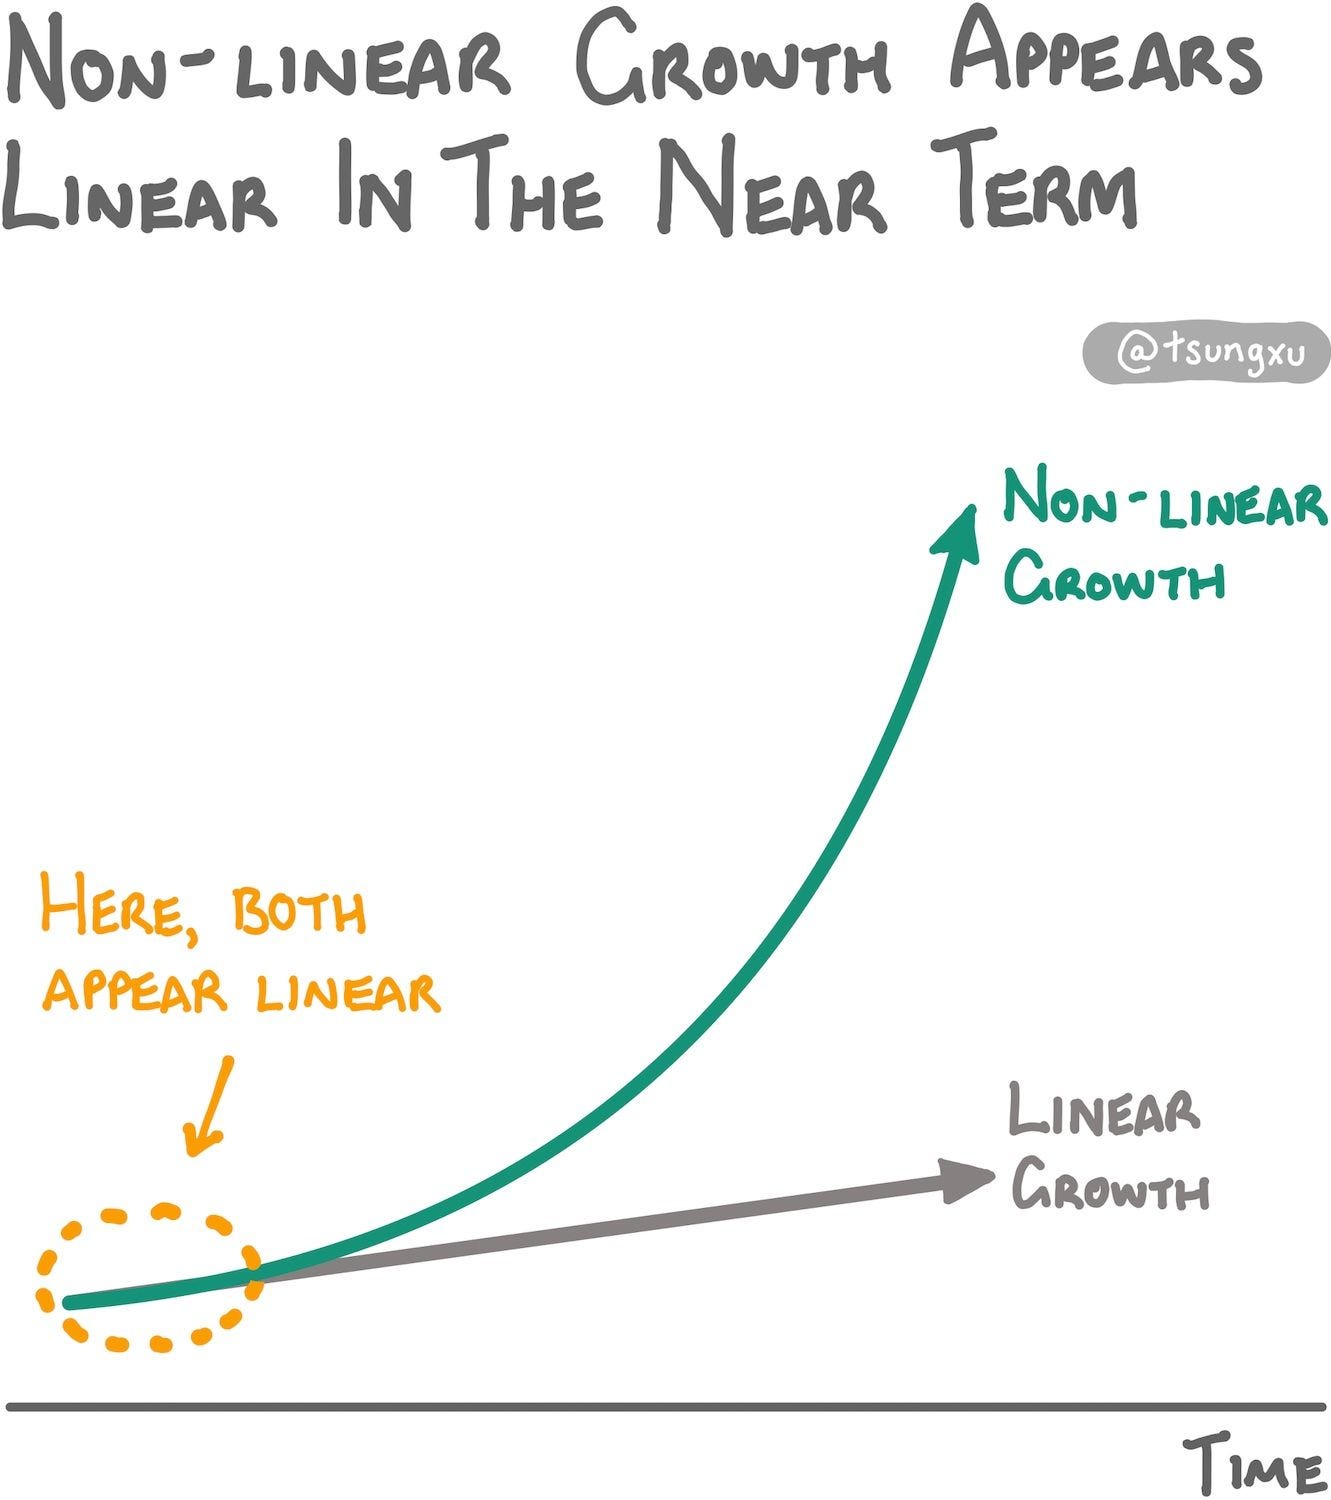
Solar, wind and batteries have grown and will continue to grow for some time like this. The problem is that over a few-year short time horizon, accelerating growth looks deceptively linear, as shown here.
Solar has grown at an average of almost forty percent every year since 1976, when good data began. From the sand grains example, you might recognize that this is a near doubling every two years. How much do you think installed solar capacity has scaled up since then? By over two million times. Of course, these growth rates will slow as we move up the S-curve. But already, we have installed enough solar to be only about a factor of 15 away from it being the primary generating source of electricity globally.
In our time, there’s a perception that we cannot quickly scale products made of atoms as fast as those of bits. Conventional wisdom holds that software scales better than hard tech. As we’ll see, this perception is not true, as some physical products in clean tech industries are scaling very, very fast.
This view probably stops many bright and driven people in developed countries working on deep and hard technologies. However, there are promising signs though that more people are looking to work in clean energy and climate.1
Key Takeaways
Let’s take a closer look at the four headline insights from the introduction.
1) Plummeting Solar and Battery Costs Are Now At Tipping Points
Solar has already become the cheapest energy source in history, alongside wind. Since 1976, solar costs (in dollars per watt) have fallen an average of over 12% per year.
Since first being commercialized in 1991, lithium-ion batteries costs (in dollars per kWh) have fallen a similar 12.9% per year on average.
These falling solar, wind and battery prices have recently hit tipping points that will drive continued growth.
The cost of solar or wind-sourced electrons are now cheaper than running existing fossil plants in many parts of the world. This is a tipping point that substantially grows the market size for solar and wind power.
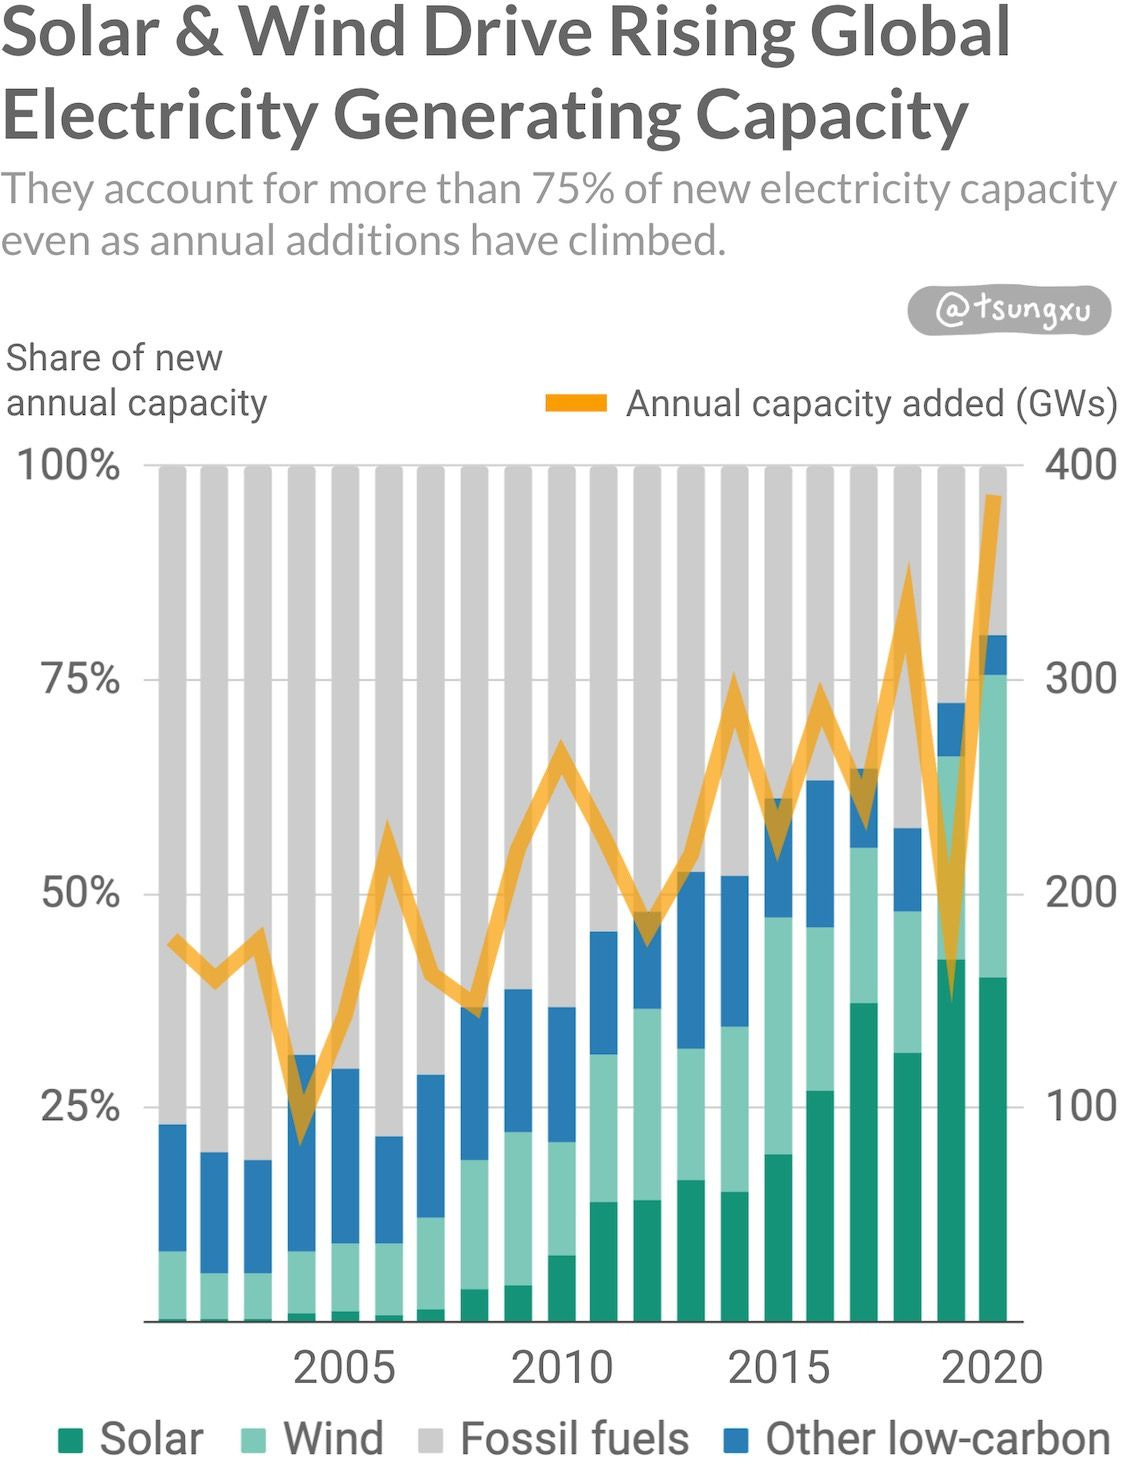
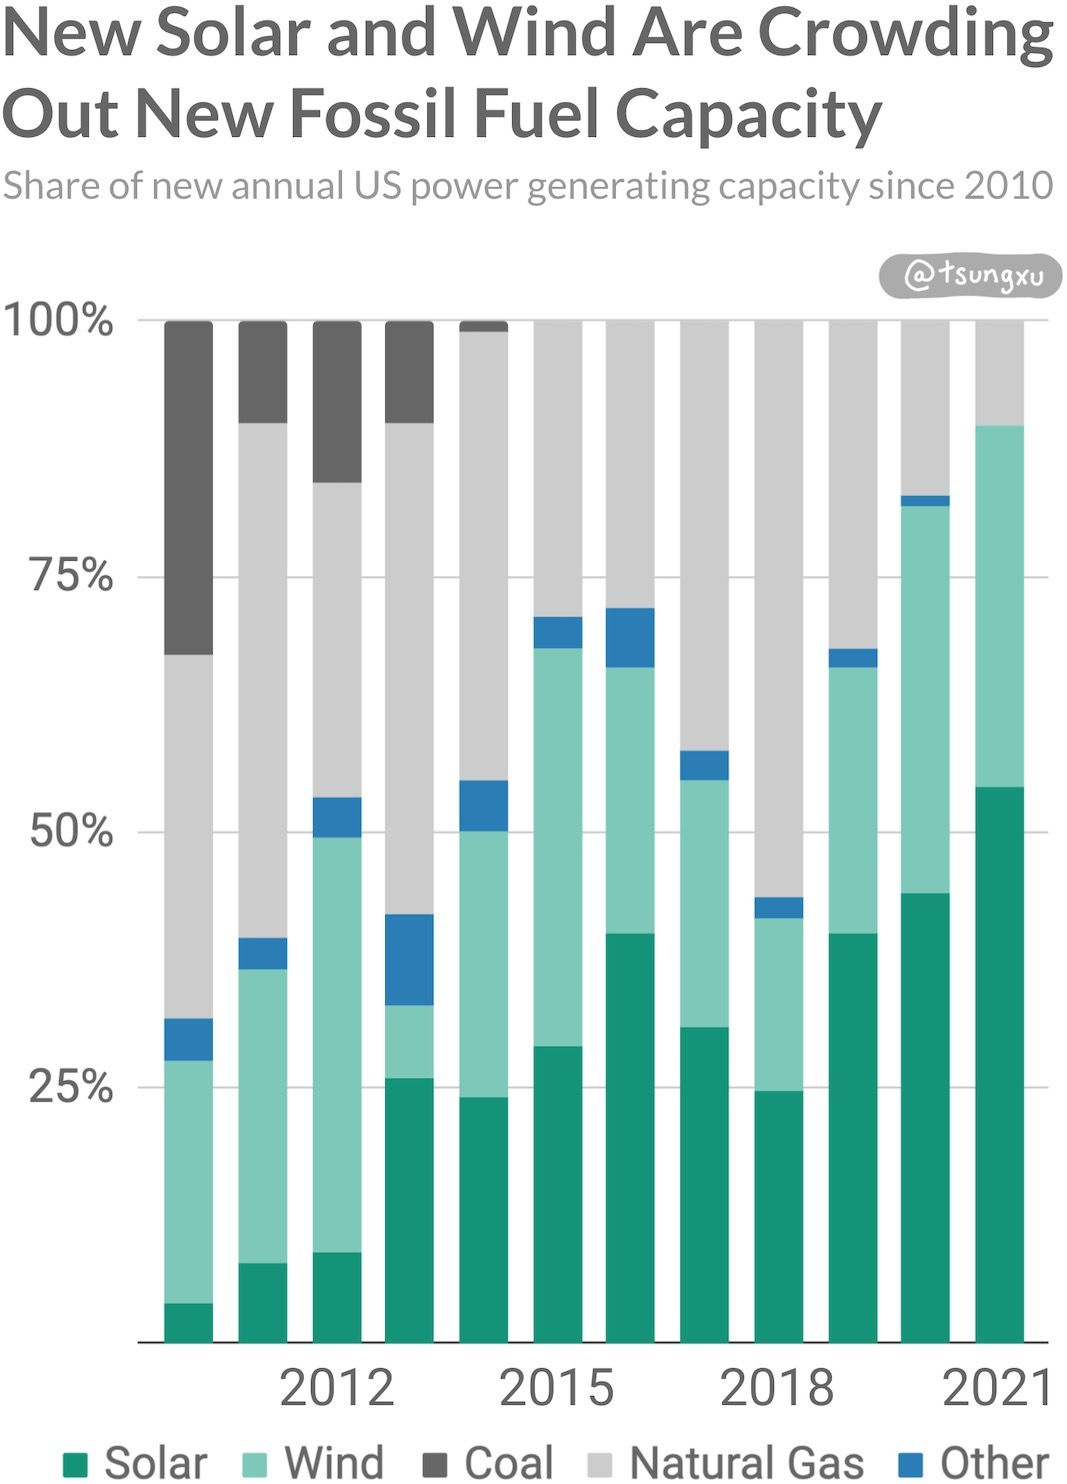
As shown above, this has led to solar and wind surging to over 75% of new global capacity to generate electricity in 2020, up from low single digit percentages in the early 2000s. As costs keep falling, solar and wind will continue to outcompete fossil fuels in more regions.
Lithium-ion batteries are now crossing cost thresholds that are powering booms in both EVs and stationary storage.
The Tesla Model 3 is as cheap as competing gasoline models from Audi, Mercedes and BMW, but outsold them all in 2020. In the next few years, a growing number of pure electric models in more countries will become as cheap as gasoline competitors. Low cost, high performance batteries are making electrified vehicles increasingly cost competitive from two wheelers to electric boats and trucks.
Storing electricity in large batteries is driving down the cost of more consistent clean energy. Battery deployments on grids in the US, China and other areas are soaring, and increasingly being paired with utility-scale solar plants. When paired, solar and batteries are mutually beneficial, being more valuable than batteries alone.
2) As Production Scales, Solar, Wind and Batteries Become Cheaper and Better
We are seeing sustained, incredible growth from these clean energy technologies.
Solar is the fastest growing energy source in history.
Electricity generated from solar has grown at nearly 40% compounded annual rate (CAGR)2 for the last twenty years. Wind is no slouch either, having generated almost 22% more electricity every year, on average, during the same timeframe.
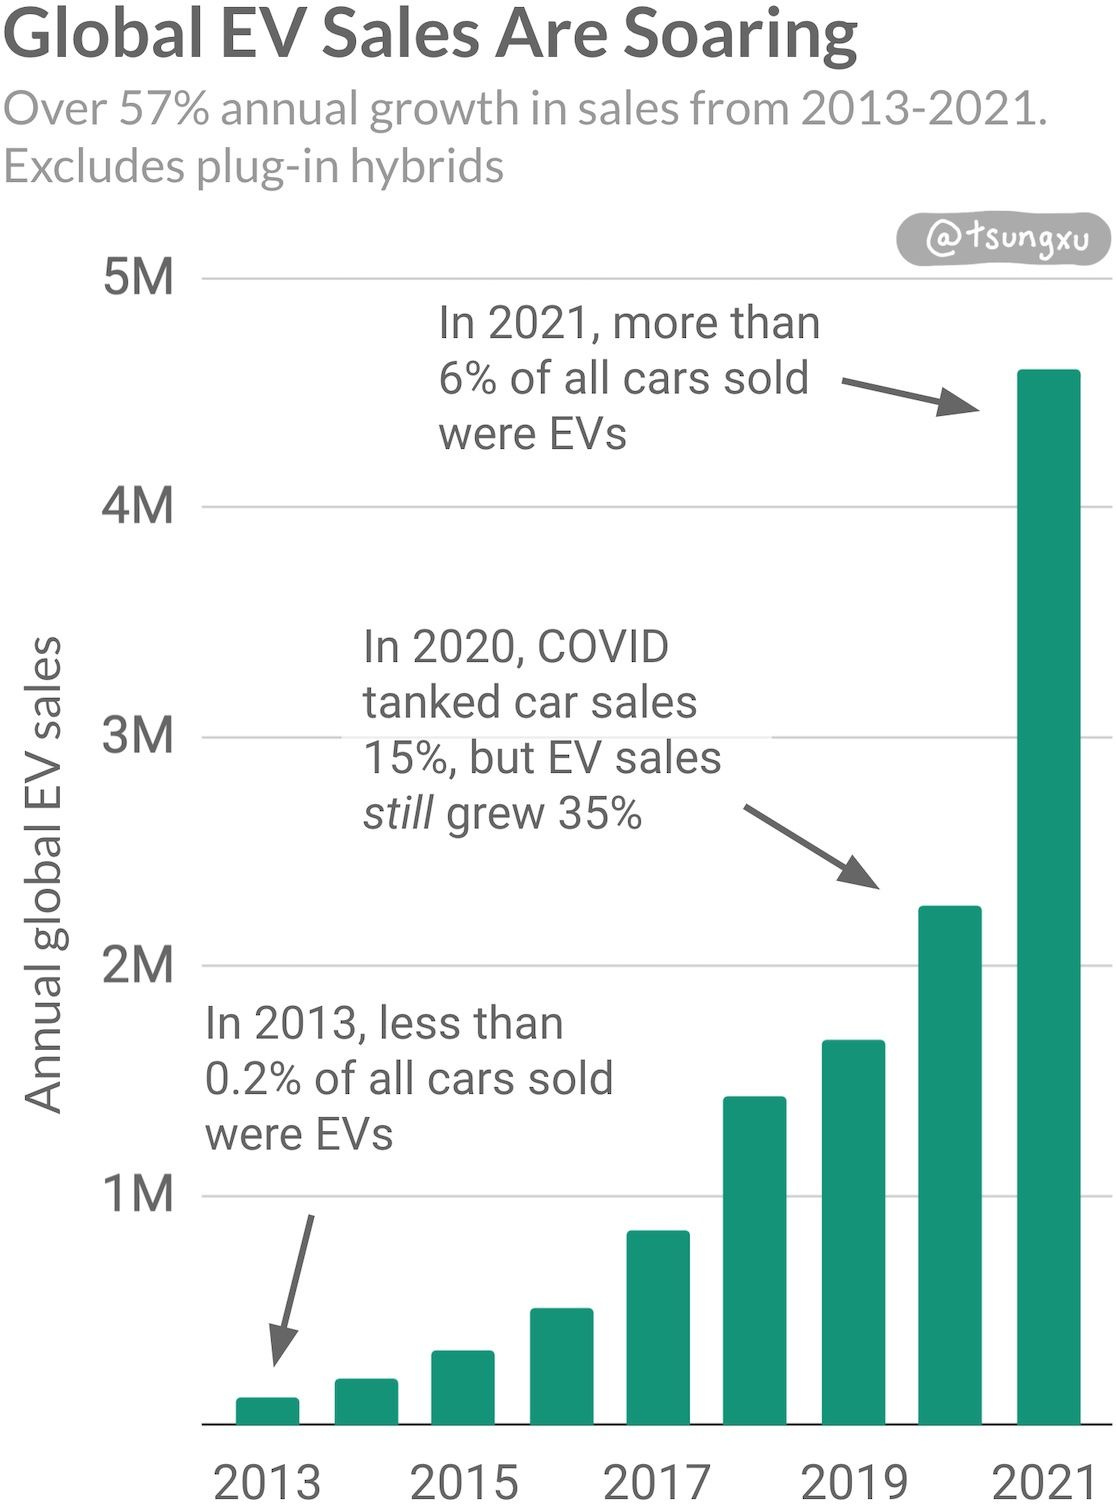
Meanwhile, electric vehicles (EVs) and large-scale storage are driving booming demand for lithium-ion batteries. EV sales have grown at around 57% CAGR in the last nine years, as shown in this chart. Storage for the grid is keeping pace, with global battery deployments growing at 58% CAGR in the last eight years.
This emerging boom in lithium-ion battery demand has created some of the world’s fastest revenue-growing companies like Tesla, CATL and others.
Solar, wind and batteries are manufactured energy technologies, not mined and extracted ones. As a result, the rapid growth in their deployment enables cost declines and better performance more akin to computer chips or electronics than fossil fuels. Coal and gas simply cannot continue to stay competitive. Whilst coal and natural gas plants have become cheaper to build as more have been deployed (capex), the cost of the fuels themselves have actually gone up over decades of deployment, driving operating costs higher.
One note is that the production of solar, wind and batteries do require the mining and processing of minerals. But once produced, unlike fossil fuels, no further extraction is needed.
This self-reinforcing feedback loop is shown in the diagram below.
Whilst costs have plummeted, solar and battery characteristics continue improving. Solar photovoltaics (PV) technology has developed with many improvements across the supply chain. Battery characteristics like energy density, cycle count and safety have also rapidly improved.
3) Cheap, Clean Electricity Enables New Industries
Solar and wind now generate the cheapest electrons in history, and are only continuing to get cheaper. This will keep driving electricity costs lower, especially for commercial and industrial uses.
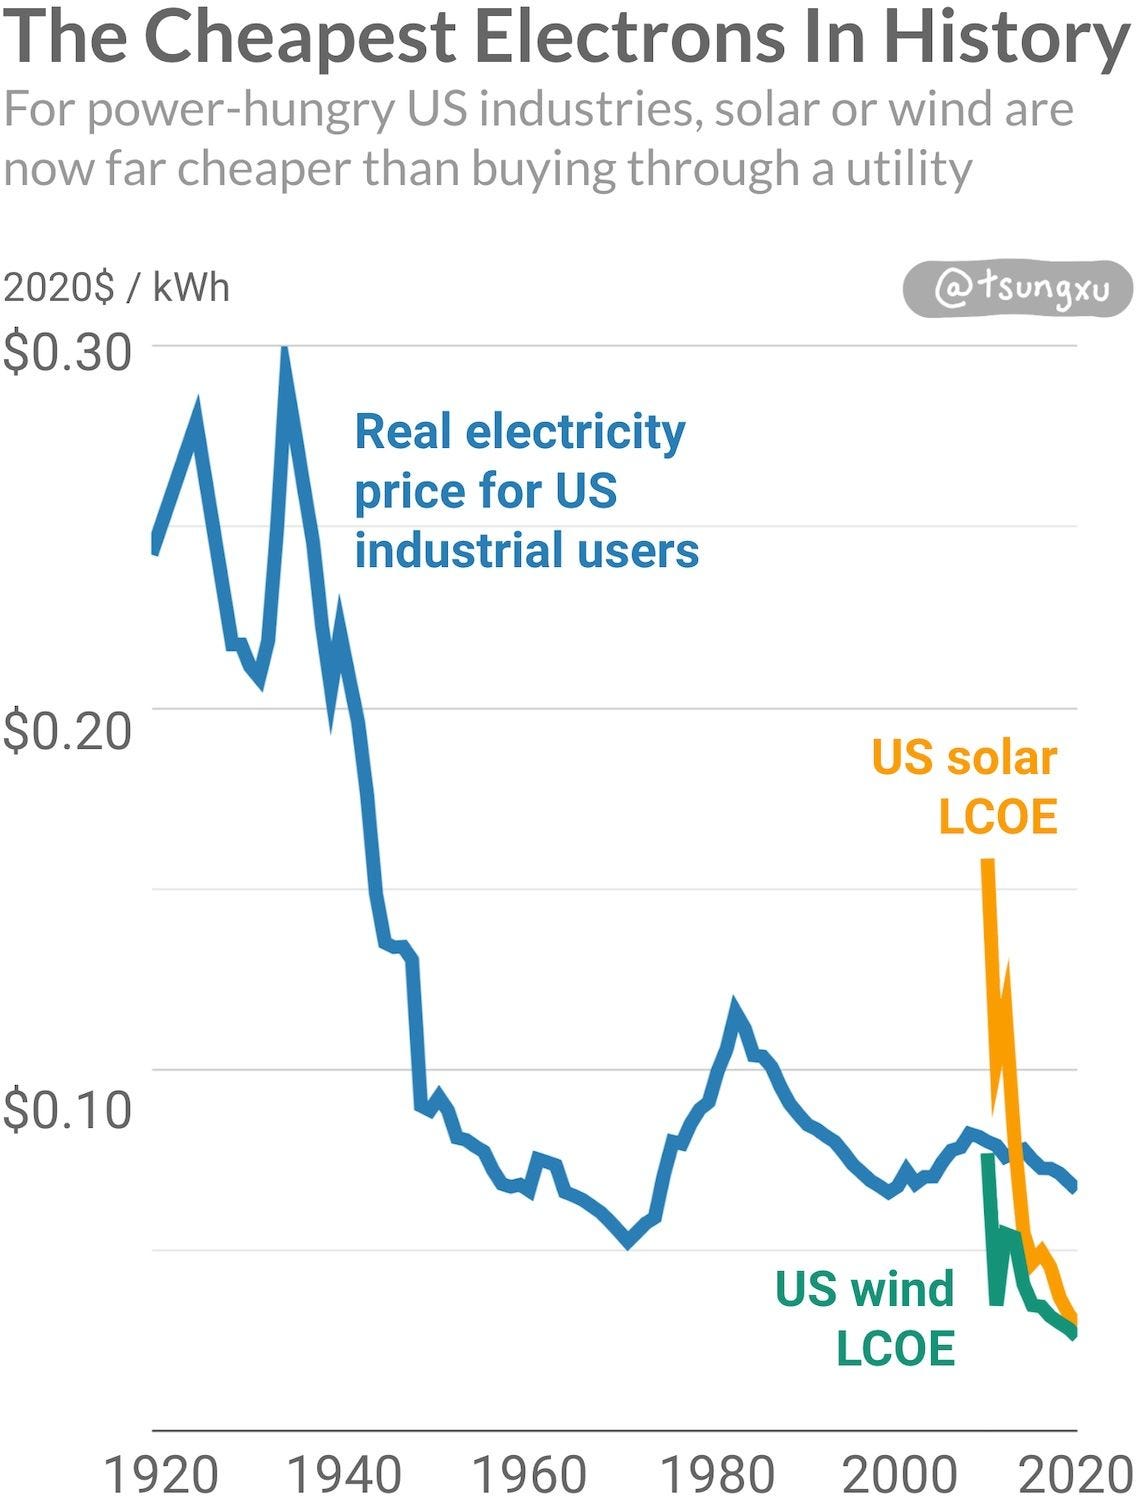
3As shown in the chart above, US heavy power users have strong incentives to purchase electricity from solar and wind power plants directly.
The pace of the cost reductions for solar-generated electrons is also historic. Falling electricity costs will create industries that are emerging now, as well as those yet to emerge.
For example, startups are betting on cheap electrons to power either CO2 capture and/or conversion. Direct air capture removes CO2 from the air. The CO2 can then be electrochemically converted into carbon-based materials, fuels and other products. Other industries are also set to take advantage of the lower cost of electrification.
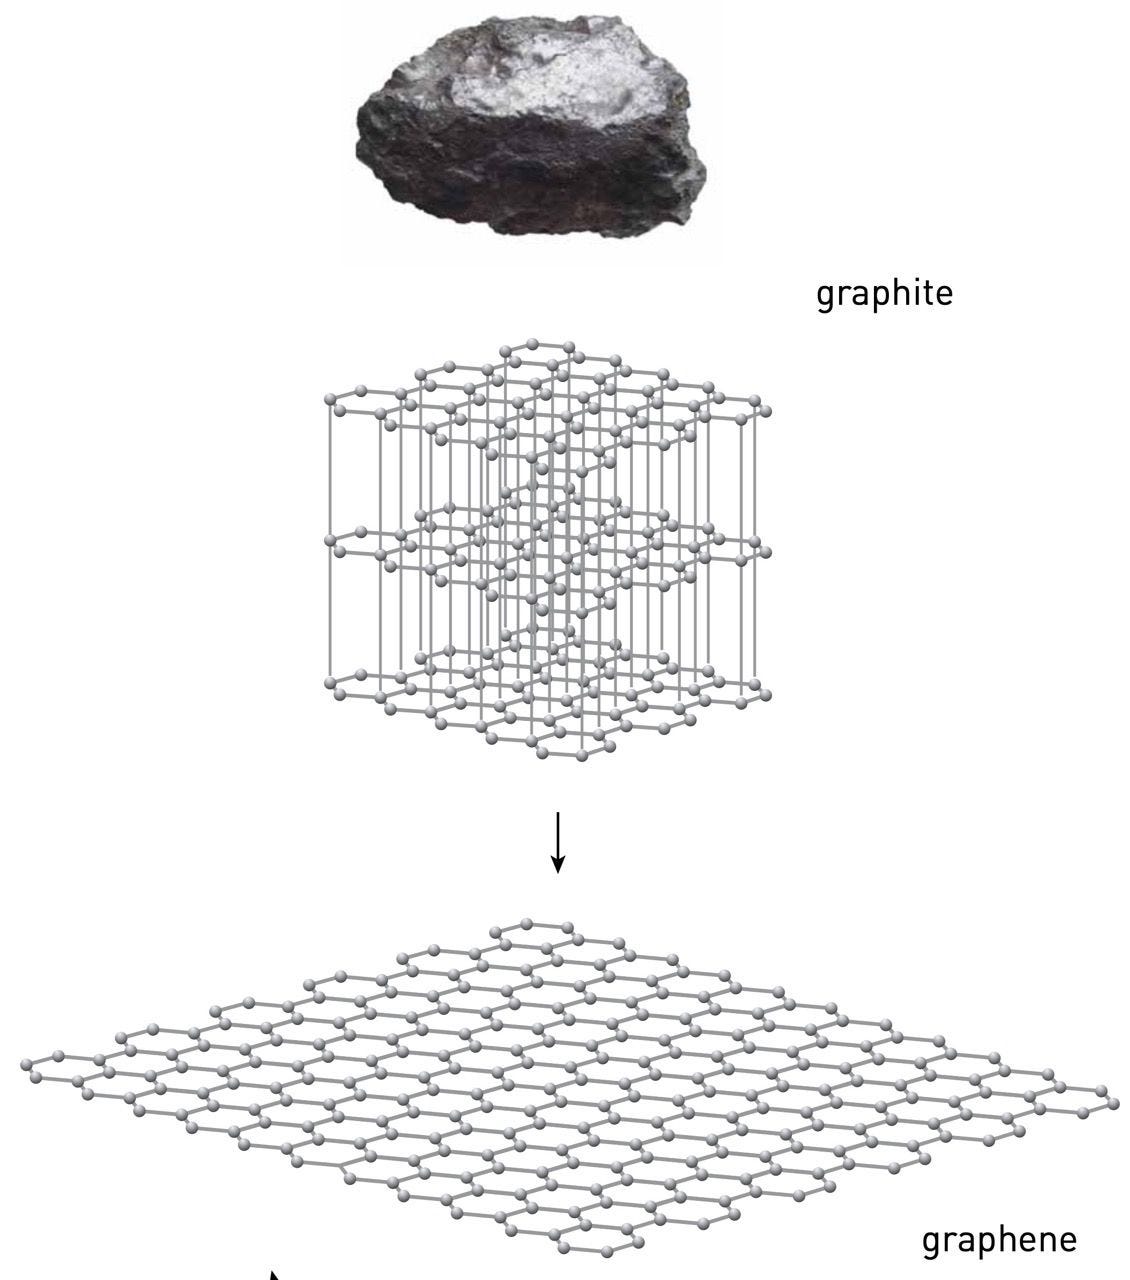
Graphene and single-layer materials had not been isolated and invented just twenty years ago. Today, these materials are growing in use in an increasing number of niche markets. Clean and cheap electrons could play a key role in accelerating adoption of emerging materials like graphene.
4) Emerging Energy Sources Scale Up Through Similar Phases
Before we dive into the clean energy transition, it’s very useful to gain a mental model of how analogous moments in history played out. Whilst there are many differences, there are also parallels between past energy transitions and this one.
We will explore the early rise of coal, oil and electricity and where they stand today. It’s easy to think that progress happens much faster today than it did in the past. This is true in some ways, but we’ll see that some energy-fueled technologies scale up surprisingly quickly, even by today’s standards.

Unless linked, stats and references in this section are from Richard Rhode’s Energy, A Human History.
1 Patterns in Previous Energy Transitions
When I first looked into the rise of coal, oil and electricity,4 I was surprised to find some patterns.
These key energy transitions in history all scale up through similar phases, as shown in the figure below.
After being discovered, the energy source (or carrier in the case of electricity) finds a foothold in niche markets where it outperforms the incumbents. Over time, as the technology matures, it can enter larger markets. Then, in the most transformative phase, new infrastructure emerges for the energy source, new materials are enabled, and new industries emerge.
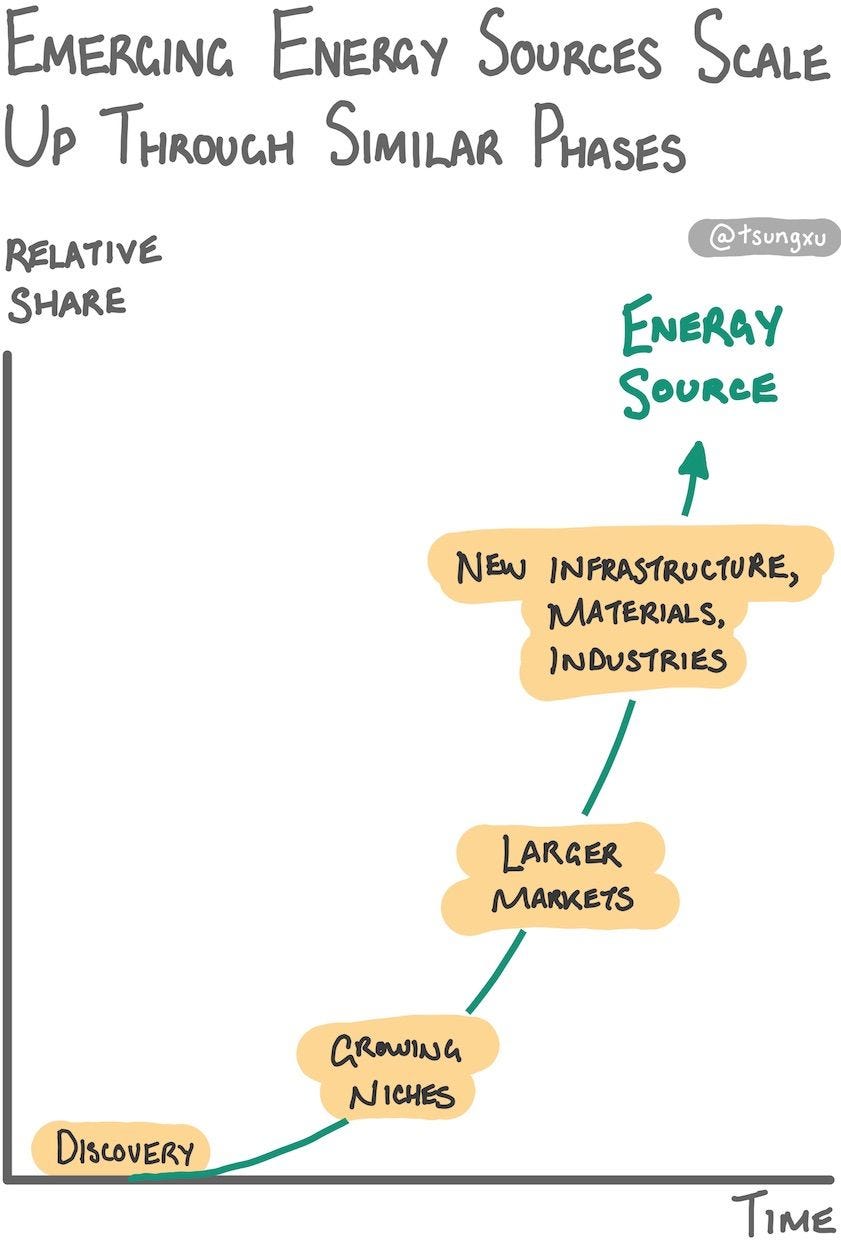
Early on in an energy transition, there is often more attention on how well they can do existing things. Examples include how well coal could heat and oil and electricity could light. But the larger impact for any energy transition, like other new technologies, is to enable us to do brand new things.
Take a steam engine tinkerer in Britain in 1800, when steam engines were mostly limited to heating, improving coal mining and industrializing iron. Could they have conceived that within fifty years, these coal-powered machines would be driving people and supplies across tracks laid all over the country? Or that fifty years after that, skyscrapers made from steel (using coke — heated coal — furnaces) would start to pop up in major cities?
Or take a car hobbyist in New York, in 1900, when there were only a handful of gasoline-powered cars on horse-dominated roads. Would they have believed that only 13 years later, Manhattan’s streets would be filled with cars and few horses would be found? Or that thirty years after that, oil would start to be refined into polymers and plastics?
Finally take an electricity innovator in the US in 1890, when the first city-wide electricity grids had been in place for less than ten years, mostly used to power lights. Would they have thought that aluminum, which was more expensive than gold not long before, would soon be commercially produced using electricity? Or that by the end of the roaring 20s, more than two in three US homes would have access to electricity?
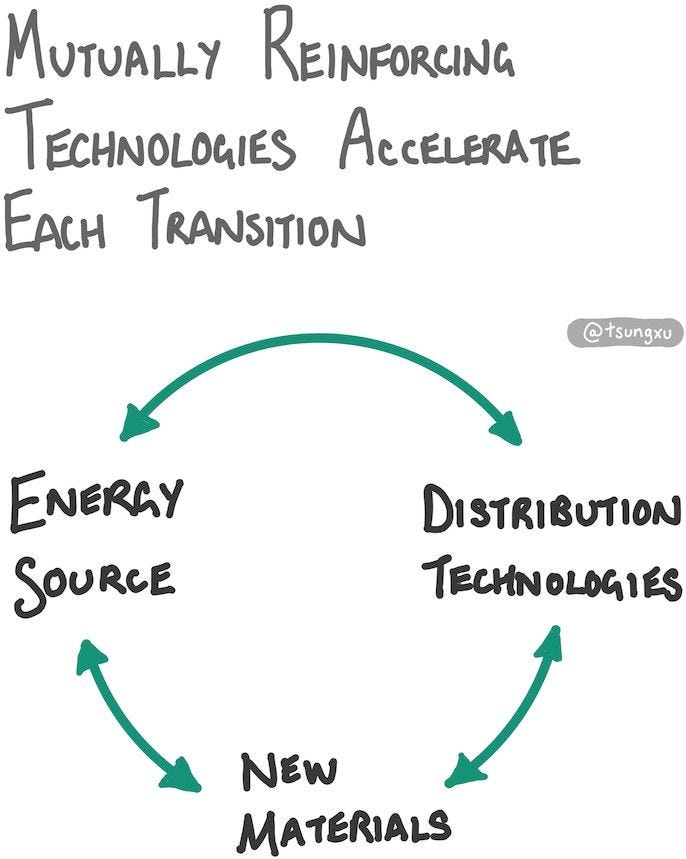
I found something else surprising about previous energy transitions. Each one later enabled new modes of transport and new materials which were very hard to conceive of during its early phases. In each of the past transitions, the energy source unlocked new distribution technologies and materials that helped drive more adoption for the energy source itself. As we’ll see later, the same is true for solar, wind and batteries.
Let’s take a closer look at each of these past transitions as a guide to what might be in store through the door of the clean energy transition.
1.1 Coal: Steam, Locomotives and Iron
Initial niche
In the 17th century, wood was scarce in England. Prices were soaring as London’s population 8x’d from 1500 to 1650, driving more demand for firewood. As more forests were cleared, wood had to be carted in on muddy roads further away from population centers. This created the opportunity for an alternative to serve the booming country.
Despite its somewhat toxic smoke, coal was cheaper and easier to get to market than wood. Back in the 17th century, coal mines were located near rivers. This way, the fuel could be sent on boats to London and other places for smelting iron or ship making. As London boomed, coal shipments to the city rose more than an order of magnitude during the century.
But early coal mines were dangerous, often flooding and killing miners. The first coal-powered steam engines, invented by Thomas Newcomen in 1712, mechanized the pumping of water out of mines. They were stationary, and as large as a small house, but good enough to prevent flooding. Their use saved the lives of many miners and enabled the early industrial scaling of coal mining.
Cast iron commercialized: larger markets
By the 1740s coal was already useful for more than space heating. Coalbrookdale Company was the first to use coked coal to smelt iron, enabling viable mass production of cast iron for the first time in history. The company also used Newcomen’s steam engines to replace horse driven pumps, reducing costs in the process. Less than 60 years later, iron had replaced wood in most manufacturing and construction uses in Britain.
Before the 19th century, coal mines were limited to being near waterways. Roads and horses were unsuitable, and so coal would be loaded onto boats. This meant coal still had to be carted from mine to the water, using wooden tracks at first.
Locomotives: distribution
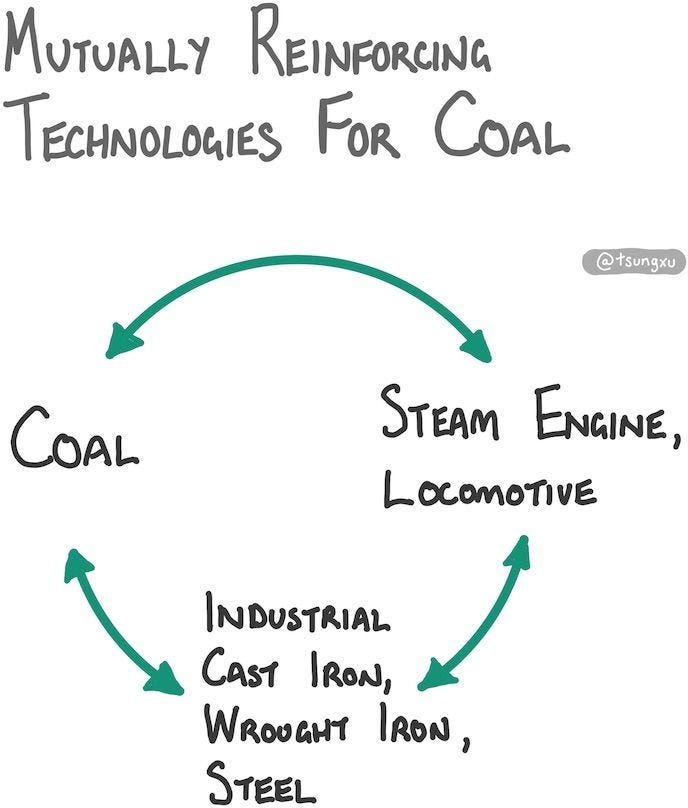
Railways were developed to solve this problem. Higher-pressure steam engines were developed in the late 18th century, and by the early 19th century improved designs were being used to power steam locomotives. Railway tracks changed from being made using wood, to cast iron and then wrought iron in this period, allowing railways to start transporting coal, other cargo, and people. Coal mines could be increasingly built further and further away from rivers.
In other words, industrial iron production and steam engines, both reliant on coal, helped unshackle the fuel’s initial limitations in supply. These technologies became mutually reinforcing, and their impact would have been hard to fathom during the 17th century. They enabled brand new things to be done.
Once coal supply was unconstrained, production grew rapidly in the 19th century and spread from England to Europe and the US. It enabled iron production to double every 10 years from 1788 for decades. If instead of coal, charcoal had been used to make the iron railway tracks, there simply would not have been enough wood in England.
Steelmaking commercialized
A breakthrough in steelmaking in the late 1850s, the Bessemer process, would help the US to catapult steel output over 400x from 1867 to 1900. By then, the US was producing one third of the world’s output. Just as back then, to this day, steelmaking largely still uses coke made from coal.5
The transition from wood to coal for industrializing countries had been the fastest and most dramatic energy shift to that point in human history. Until then, we had been using wood-based biomass for heat and raw materials for millions of years.
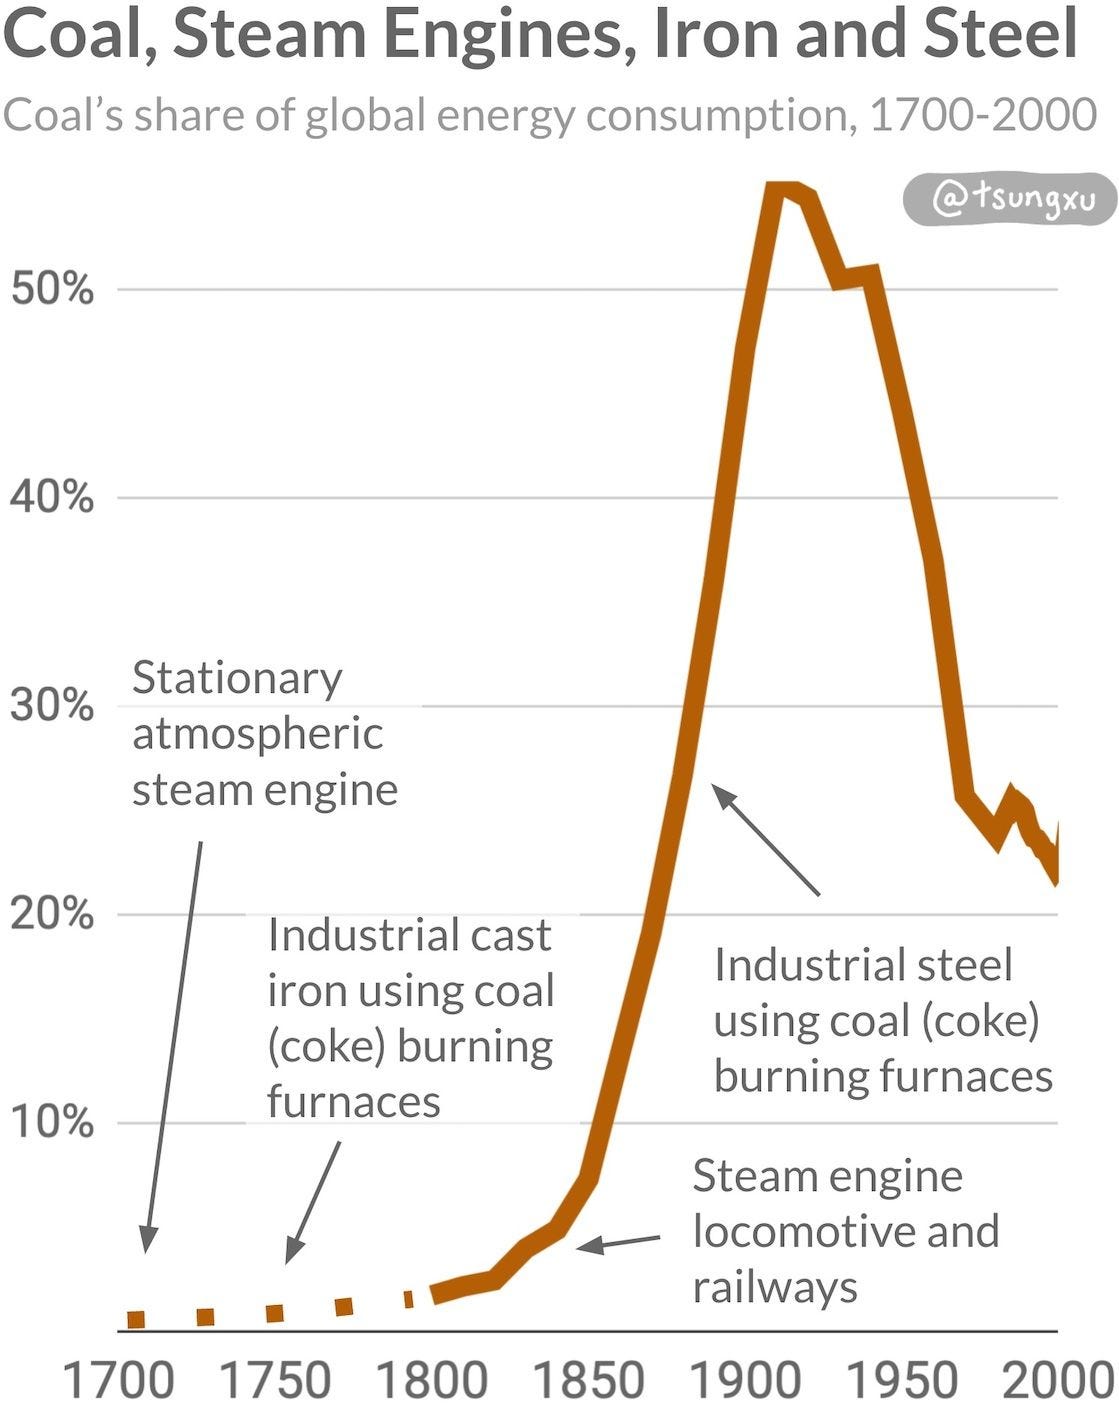
By 1900, coal was dominant, as shown in this chart. It supplied over 90% of the UK’s and 70% of US energy.
But only ten years later, coal’s energy use would peak, largely because oil was rapidly on the rise.
1.2 Oil, Internal Combustion Engines and Polymers
Initial niche
The initial product-market fit for oil was lighting. The search for oil was driven by finding a cheaper feedstock for kerosene, an oil for lighting that had been previously refined from coal. The first well in the US, drilled using a steam engine, started producing in 1859. Oil could be refined into kerosene and only 6 years the oil market for lighting had already 10x'd production.
The oil rush was on, initially in the US in Titusville, Pennsylvania. But, like coal, there were transport and storage problems to be overcome. It took 3 years for a rail connection for the town, and another year for the first rail-to-well oil pipeline.
John D. Rockefeller's Standard Oil was the emerging dominant oil refiner. He consolidated supply and made deals to reduce costs for kerosene by 55% from 1865 to 1870. Standard Oil drove efficiencies in refining, including using gasoline to help power refineries. Before gasoline found a market in internal combustion engines, other refiners were dumping it, often into rivers. Sounds incredible today, but then, they just wanted to make kerosene.
By 1870, cheaper oil-refined kerosene had cornered the US lighting market. But despite supplying almost 5 million barrels produced in Pennsylvania that year, lighting was still just an early wedge into bigger markets. There would be no bigger market for oil, and perhaps any other energy source until our time, than the internal combustion engine.
Engines and automobiles: distribution
The success of the internal combustion engine (ICE) would become the primary driver of oil demand for the 20th century.
Around 1900, steam engine powered cars and even electric battery cars were more popular than ICE cars in the US. In Europe, Porsche’s P1 (standing for Porsche number 1), was built in 1898 with a lead acid battery. However, the early lead of steam and electric car adoption would be short lived. Despite being a mature technology, steam engines were complicated to operate and appealed mostly to early-adopter hobbyists. Electric vehicles lacked charging infrastructure outside of cities, during a time when far more people lived in rural areas.
In the 1900s, ICE vehicles didn’t have the tech maturity of steam engines, nor the simplicity of electric cars. But thanks to the oil boom, ICE cars had refueling infrastructure distributed across the US. In the decades prior, gasoline derived from oil had found many uses outside of cities, used as a cleaning agent and solvent. Farmers had adopted stationary gasoline engines for “everything from washing machines to grain mills”.6 This meant general stores in rural and urban areas were stocked with gasoline.

Gasoline had superior distribution, and automobiles were increasingly cost effective. By 1914, there were nearly 1.7 million registered US motor vehicles, a market that grew at a CAGR of 46% over 14 years. See the photo taken in 1913 on 5th Avenue above. Only 13 years earlier, in 1900, there were almost no cars on the road. This was a remarkably quick transition, which, as we’ll discuss later, bodes well for electric vehicles in the 2020s.
Almost all vehicles sold by then were ICE powered. The Ford Model T had helped rapidly scale adoption of ICE vehicles by lowering costs dramatically. Henry Ford designed the car to have fewer parts (less than 100) which were interchangeable between cars, greatly increasing factory worker efficiency and streamlining the manufacturing process.
Polymers: a new class of material
Oil-derived polymers would become an entirely new class of materials. Bakelite, invented in 1907, was the first synthetic polymer and was actually made from coal. It was used as an electrical insulator for the rapidly electrifying US and in everything from radios, irons, combs as Time magazine praised in a 1924 cover. The success of Bakelite kicked off a race between chemical companies to discover new synthetic polymers, even if they did not have uses at first.
The R&D investment into synthetic polymers by many chemical companies started to pay off in the 1930s. Nylon was invented and used in WW2 (and to this day) for parachutes, ropes and stockings. Plexiglass was used in aircraft windows and polyethylene7 became used for packaging.
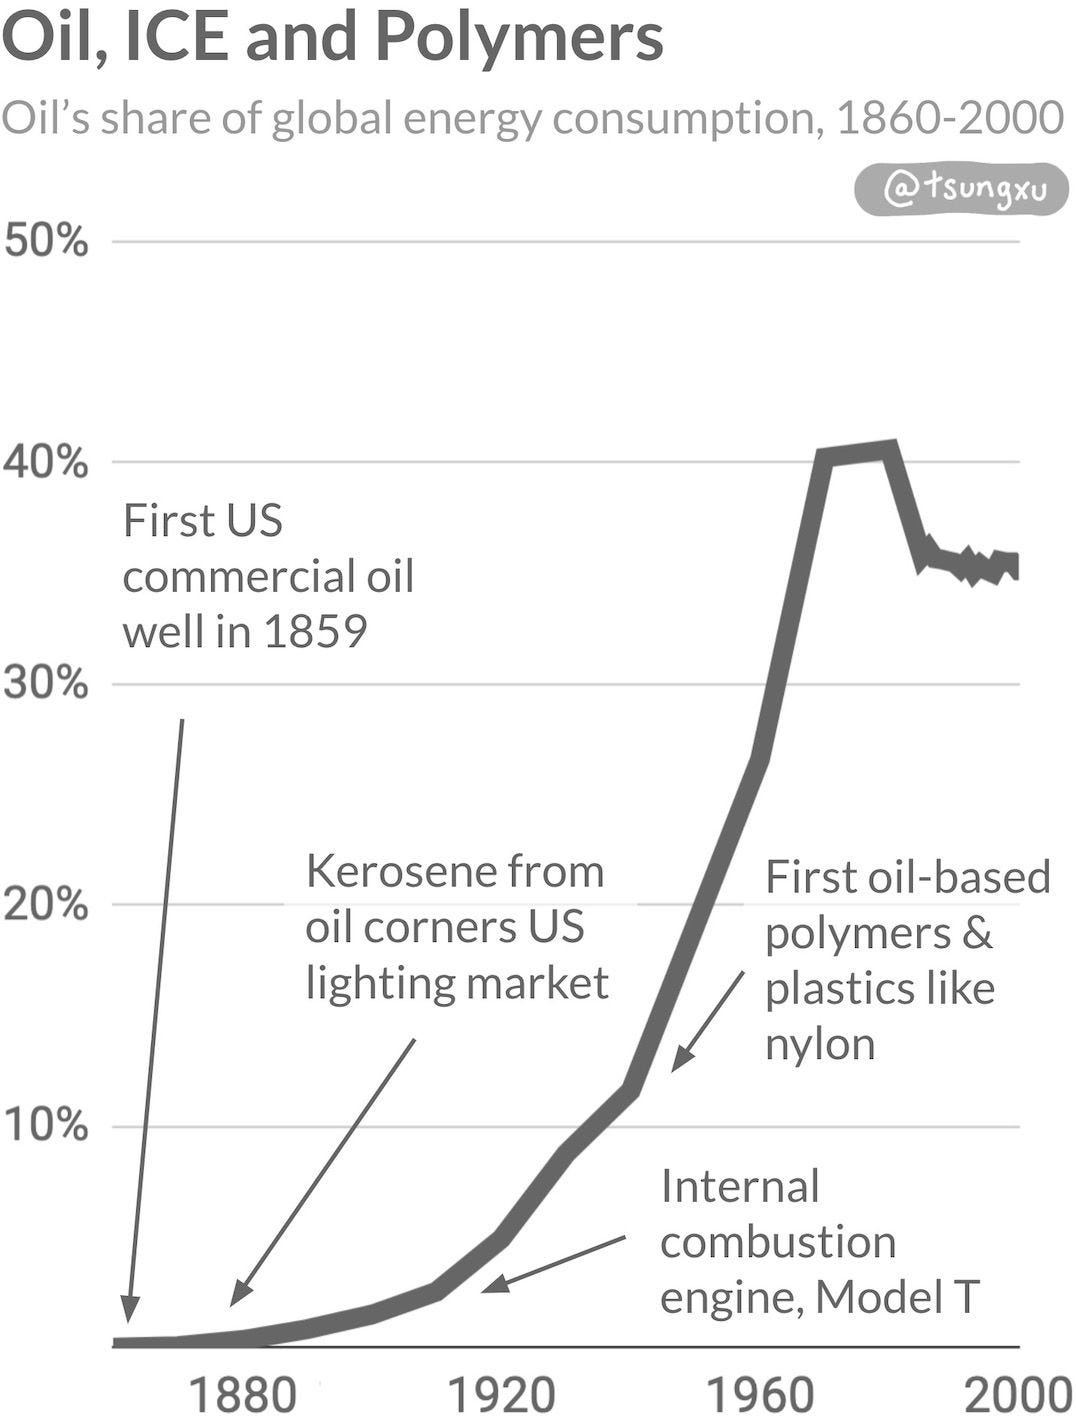
Just as with coal, the widespread use and distribution of oil enabled new materials to be developed and used at scale, as shown here. Entire new industries were created.
As remarkable as it was, one key thing limited oil’s rise. Cost. Oil has never been viably cheap enough to produce electricity, unlike coal, or later natural gas and now solar and wind.
Parallel to the rise of oil, electricity was also gaining traction. Despite its already huge impact in the 20th century, electrification is really just getting started.
1.3 Electricity, Aluminum and Transmission Lines
Initial niches
After more than a century of research progress, electricity was still to be commercialized in the mid 19th century. Some early uses like the telegraph and telephone had already proved useful. However, at the time, there were no use cases that required more abundant sources of electrons.
Thomas Edison’s commercialization of the incandescent light bulb in 1879 was the early killer app. Light bulbs were brighter and lasted much longer than kerosene lamps. Ironically, oil had only started replacing coal in supplying kerosene twenty years before Edison’s invention.
Early electric light adoption was rapid. In 1882, only three years later, Edison had set up the US’s first commercial power plant in lower Manhattan, initially for 82 customers on a few blocks. Two years after that, Edison was supplying over 500 people with over 10,000 electric lights.
Early distribution wars
Electricity could only be transmitted very limited distances and used direct current (DC) infrastructure at the time. Edison backed DC but copper wires melted if transmitted over long distances. Plus, there were only so many polluting coal power plants that people could tolerate near cities.
It took a shift from DC to alternating current (AC) to distribute electricity much more widely than a few city blocks. Once developed and tested in the 1880s-90s, it could transmit electrons dozens of miles initially, with transmission range increasing with higher voltages.
Aluminum commercialized
The electricity generated was also cheap enough to enable materials like aluminum to be produced cost-effectively for the first time.
When opened in 1895, Niagara Falls hydropower was first used to power Alcoa’s third ever smelting plant. Before electrolysis of its oxide was possible with cheaper electrons, the metal was difficult and expensive to refine from ore. It had been more expensive than gold, and rare as a result.
Global aluminum production would 15x from 1900 to 1916 as electrolysis costs fell and the metal found more uses. The Wright Brothers used an aluminum alloy plane engine in 1903, and aluminum began being widely used in airplanes in WW2 and satellites during the space race.
Aluminum also replaced copper in transmission lines, allowing longer distance lines to be more economically feasible. It was cheaper, lighter and allowed for lighter (and also cheaper) transmission towers to be built, despite not being as conductive as copper.
Electrified appliances: growing markets
Homes and buildings became increasingly electrified, with about five in six households connected to the grid by the end of the 1920s. Electricity usage per household kept growing as more appliances became widespread, especially after WW2. Washers, fridges, TVs, air conditioners, dishwashers all made their way into homes in developed countries by the 70s.
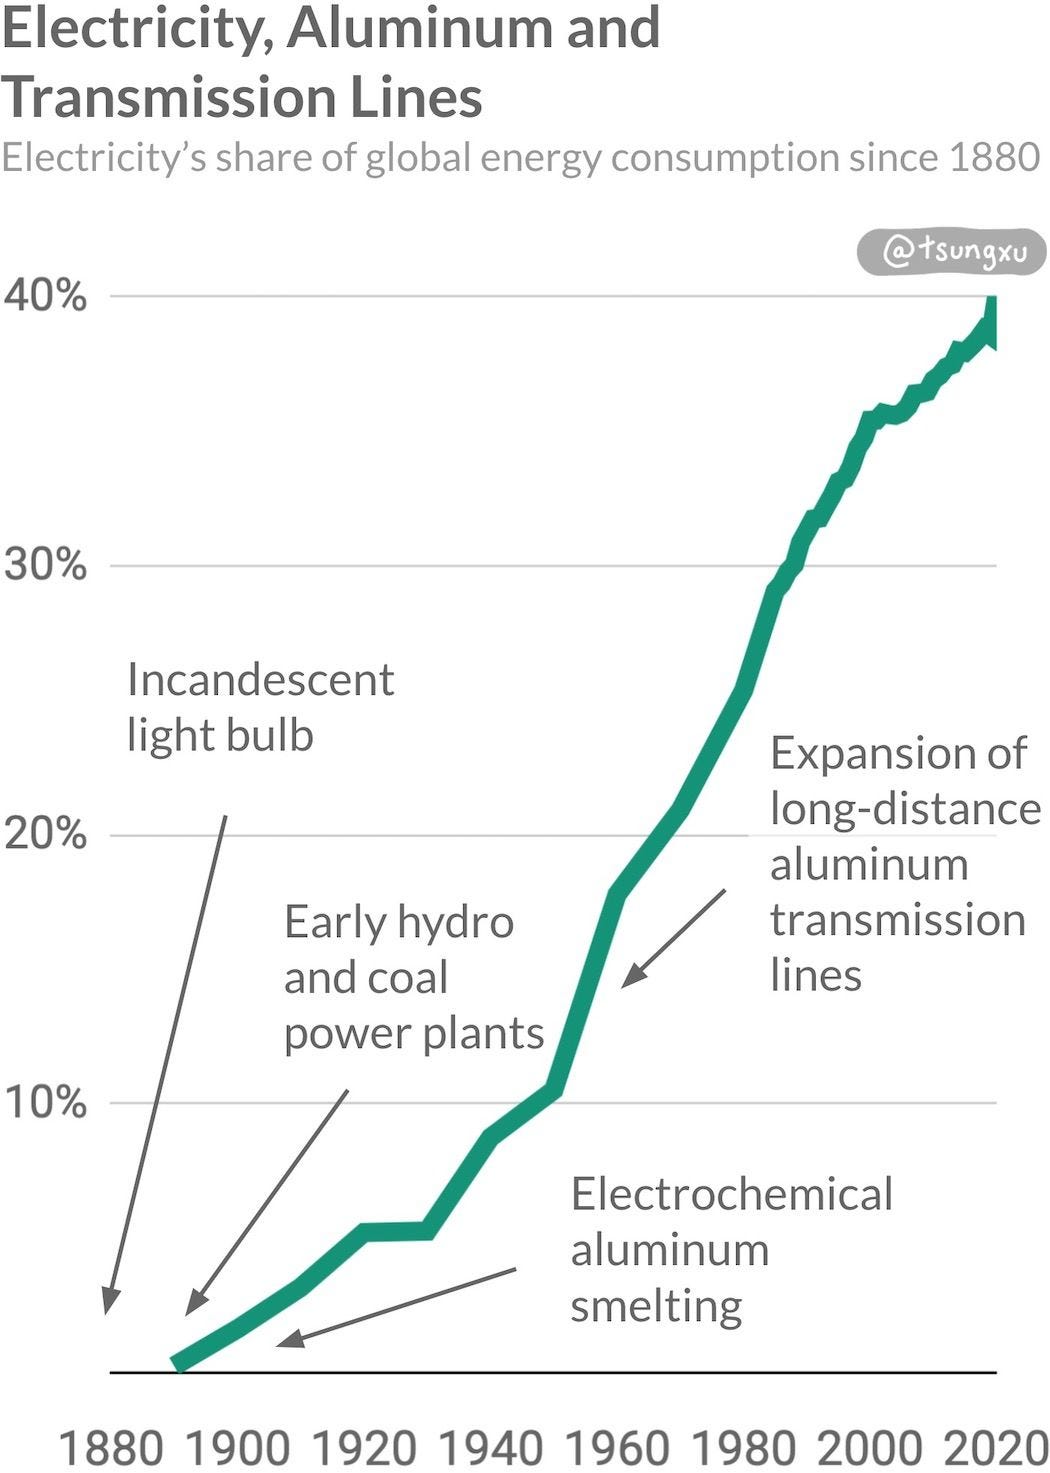
The increasing electrification of energy usage meant that a larger share of fossil fuels (coal and gas in particular) were producing electricity, and not for other end uses. As shown above, in 1900, less than 2% of the world’s fossil fuel production was converted into electrons, but by 2020, almost 40% was.
Fossil fuels are becoming less competitive with solar, wind and batteries, the new kids on the energy block. Now, another transition is well underway.
1.4 Clean Energy Now On The Rise
Despite all their vices and limitations, coal and oil fueled (no pun intended) the rapid progress in technological progress, and improved standards of living for billions. But the age of using prehistoric dead plants to power our economies is coming to an end.
Let’s look at energy transitions through the lens of innovation cycles, thinking back to how hard it is to understand non-linear growth.
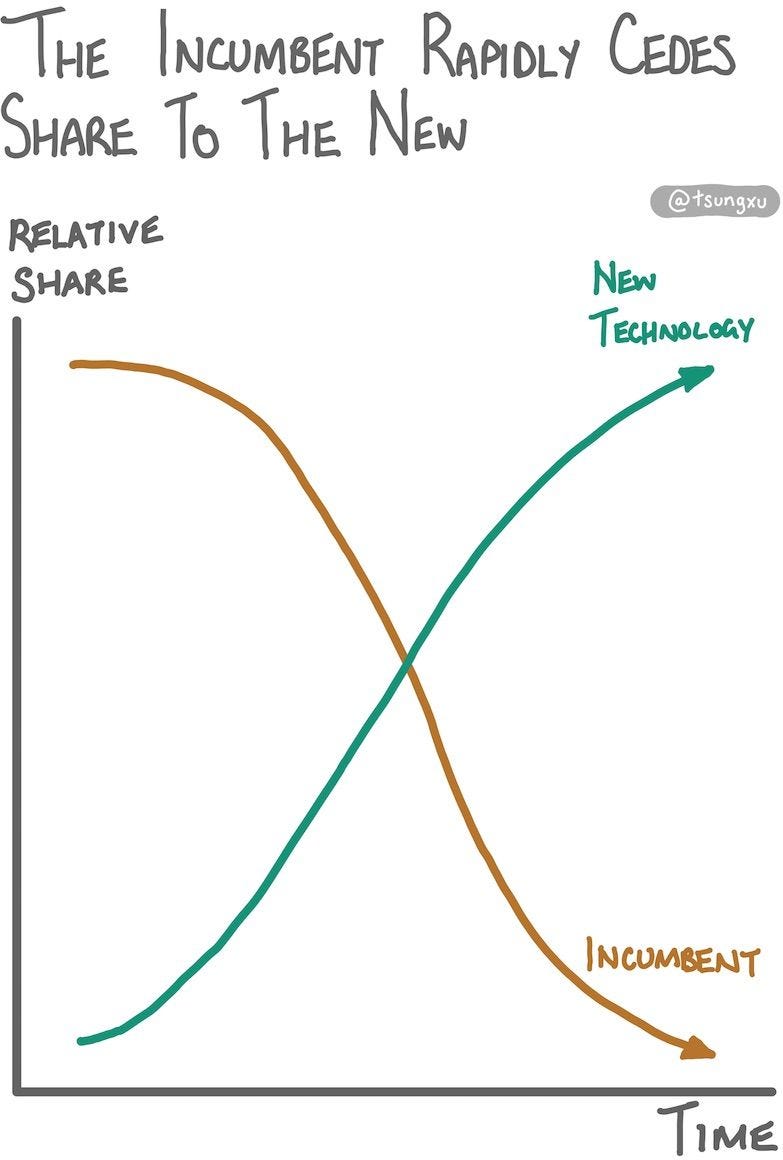
Early on in the figure above, the incumbent has a high relative share of the market. they seem to be maintaining the share well. However, the new technology is rising. It is growing at a non-linear rate to take market share every year from the incumbent. Before the incumbent can react, the new has already surpassed it in market share.8
This has happened over and over throughout history. Horses disappeared off roads as ICE cars took over; offline share of advertising dollars were replaced by online ads; Nokia did not respond to the rise of smartphones; Taxis have been mostly usurped by ridesharing.
Incumbent disruption also applies to the energy industry and energy transitions. Few people alive have lived long enough to be a part of one, unlike for many of the examples I just gave.
How the transitions are playing out
In the chart below, we see a high-level view of how energy transitions from coal to oil and electrification played out. I’ve only included these three as they are the most globally important and dominant energy sources (energy carrier in electricity’s case).9
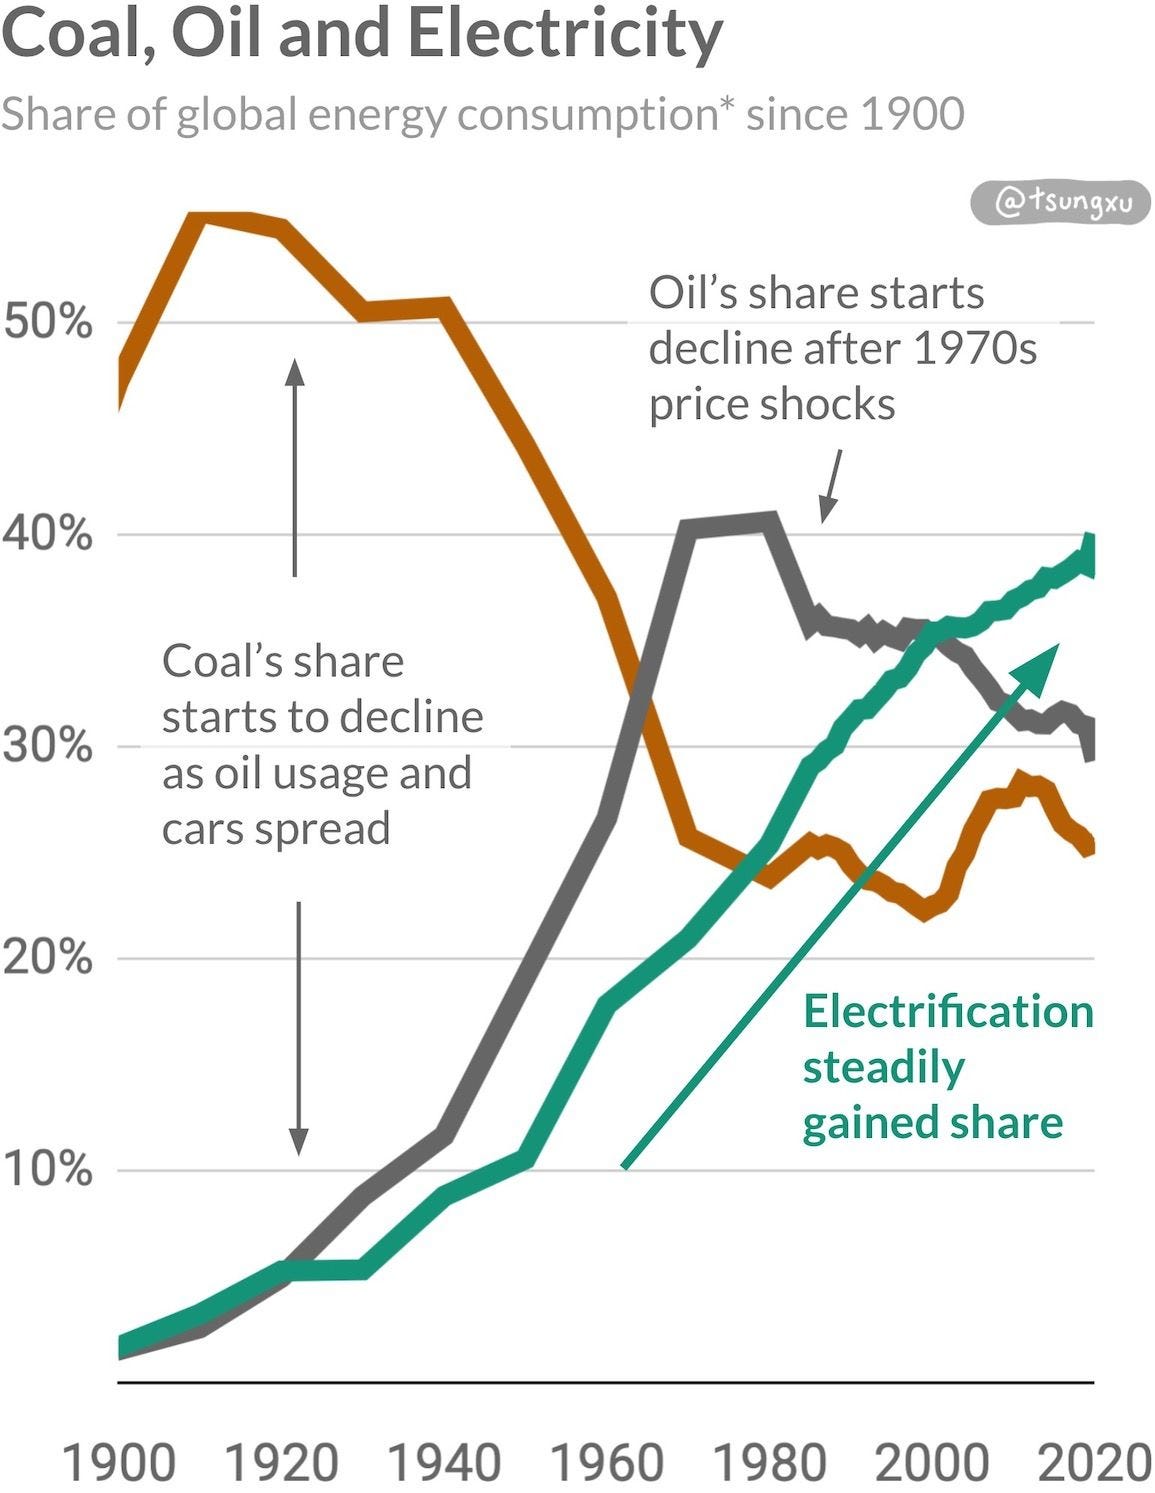
10Coal’s share of global energy consumption had already peaked earlier in around 1910, when the growing adoption of ICE vehicles allowed oil to rapidly start to eat into coal's share.
By the 1970s, oil was the most important energy source, peaking at above 40% of global energy consumption during the oil crises of the 1970s. Natural gas use has only increased somewhat from 14% in 1985 to 24% in 2019 despite US production rising dramatically since 2005.
Electrification of energy has been playing an increasing role in the last 120 years. Around 40% of global energy usage is electrified, using the substitution method. Another lens on the rise of electricity is that over 30% of (mostly) coal and gas is converted into electricity globally, because that’s a very productive use of those fossil fuels today.
Clean energy is rising and accelerating
In the last 10 years, solar and wind have been eating into coal’s dominance in generating electricity. They generated 1% of global electricity in 2007 and were closing in on 10% in 2020.
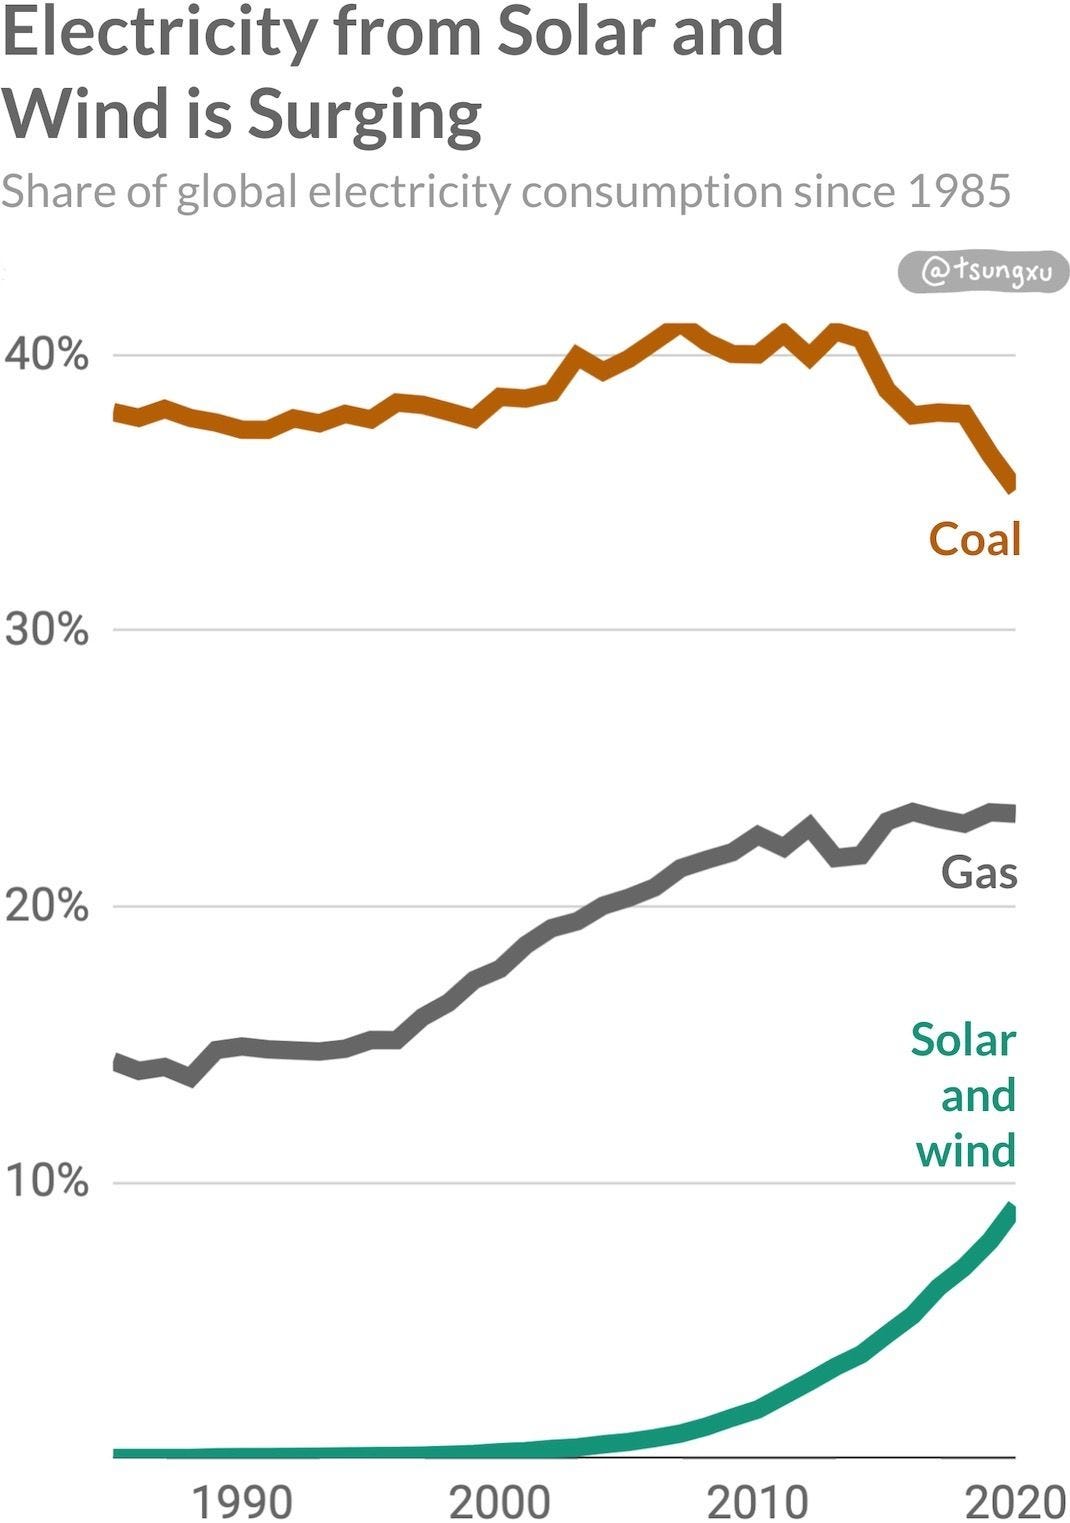
Fossil fuels are increasingly uncompetitive against solar and wind in generating electricity. New solar and wind power plants are cheaper to build than running existing coal and gas plants in almost half of the world. That has a lot to do with why over 80% of new electricity capacity in 2020 was from renewables, and the vast majority of that was from solar and wind.
It’s only a matter of years, not decades, before the world is building almost exclusively clean low-carbon power plants. Soon, there will be more coal and gas retirements than new solar and wind plants being added.
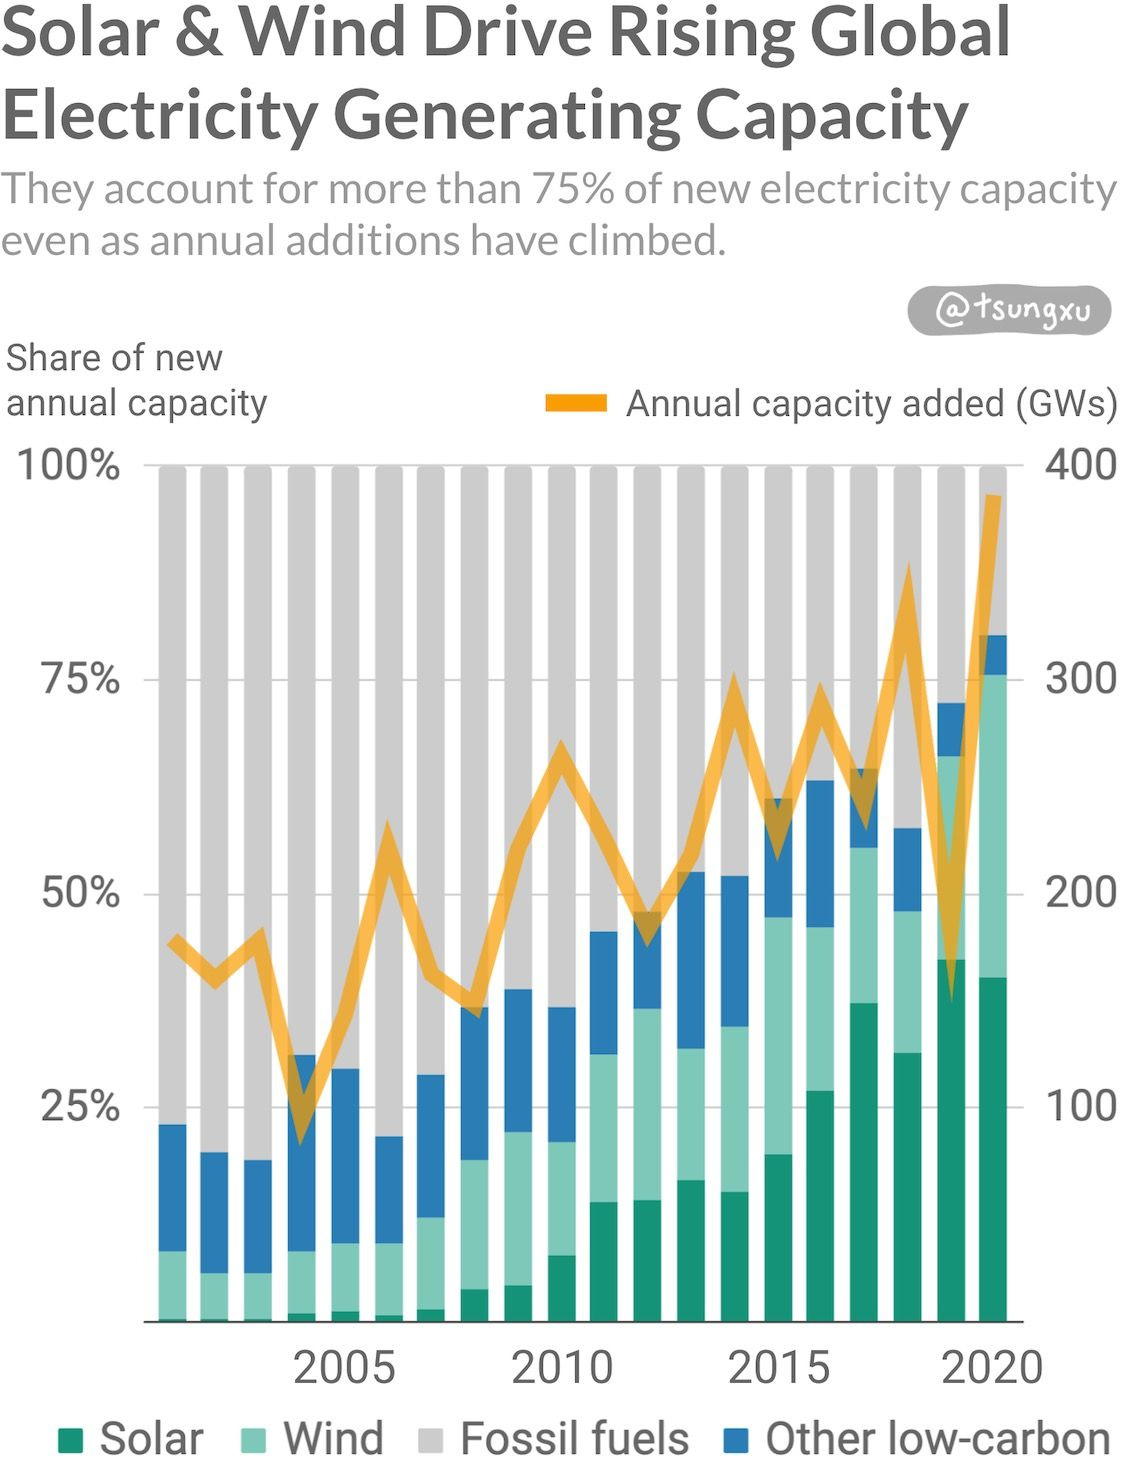
This trend is clearly visible in the chart above. The share of new electricity capacity from solar and wind topped 75% in 2020, having surged from around less than 6% in the mid 2000s. In that time, fossil fuels have shrunk from contributing over 80% of new capacity to less than 20%. This is a remarkable inversion in twenty years.
Despite rapid progress, solar and wind face growing pains. I’ll come back to the big challenges like intermittency, i.e. power only when the sun shines or wind blows, and the lack and slow speed of more transmission buildout.
Clearly, the clean energy transition is eating into the share of fossil fuels and at an accelerating rate.
A quick note about nuclear fission plant deployments, which had boomed during the 1960s and 70s. Meltdowns including at Three Mile Island, Chernobyl and Fukushima drove anti-nuclear sentiment, despite fission power being far safer than burning fossil fuels. That led to permitting and regulatory delays in fission plants being approved, with many projects being canceled and facing massive cost overruns.
Let’s next dive into the core of the clean energy transition to see how clean electrons (especially solar) are growing so quickly, why most pundits and industry insiders underestimated the growth and their foundational role in the clean energy transition.
2 Generation: Solar and Wind
We have never seen energy technologies like solar and wind before.
For the first time in history, we can manufacture the generation of energy. Once built, solar and wind equipment cost very little to operate. In other words, they are basically zero marginal cost electron sources.
Their fuel, either sunlight or wind, is free, and renewable. Solar in particular is modular and fractionalizable, meaning one panel can be installed on a rooftop or literally millions of panels at one site.
They have also gained traction fast. Historically fast so far, as the following chart shows. Of course, as deployments keep rising, the pace will likely slow down a little in the coming years.
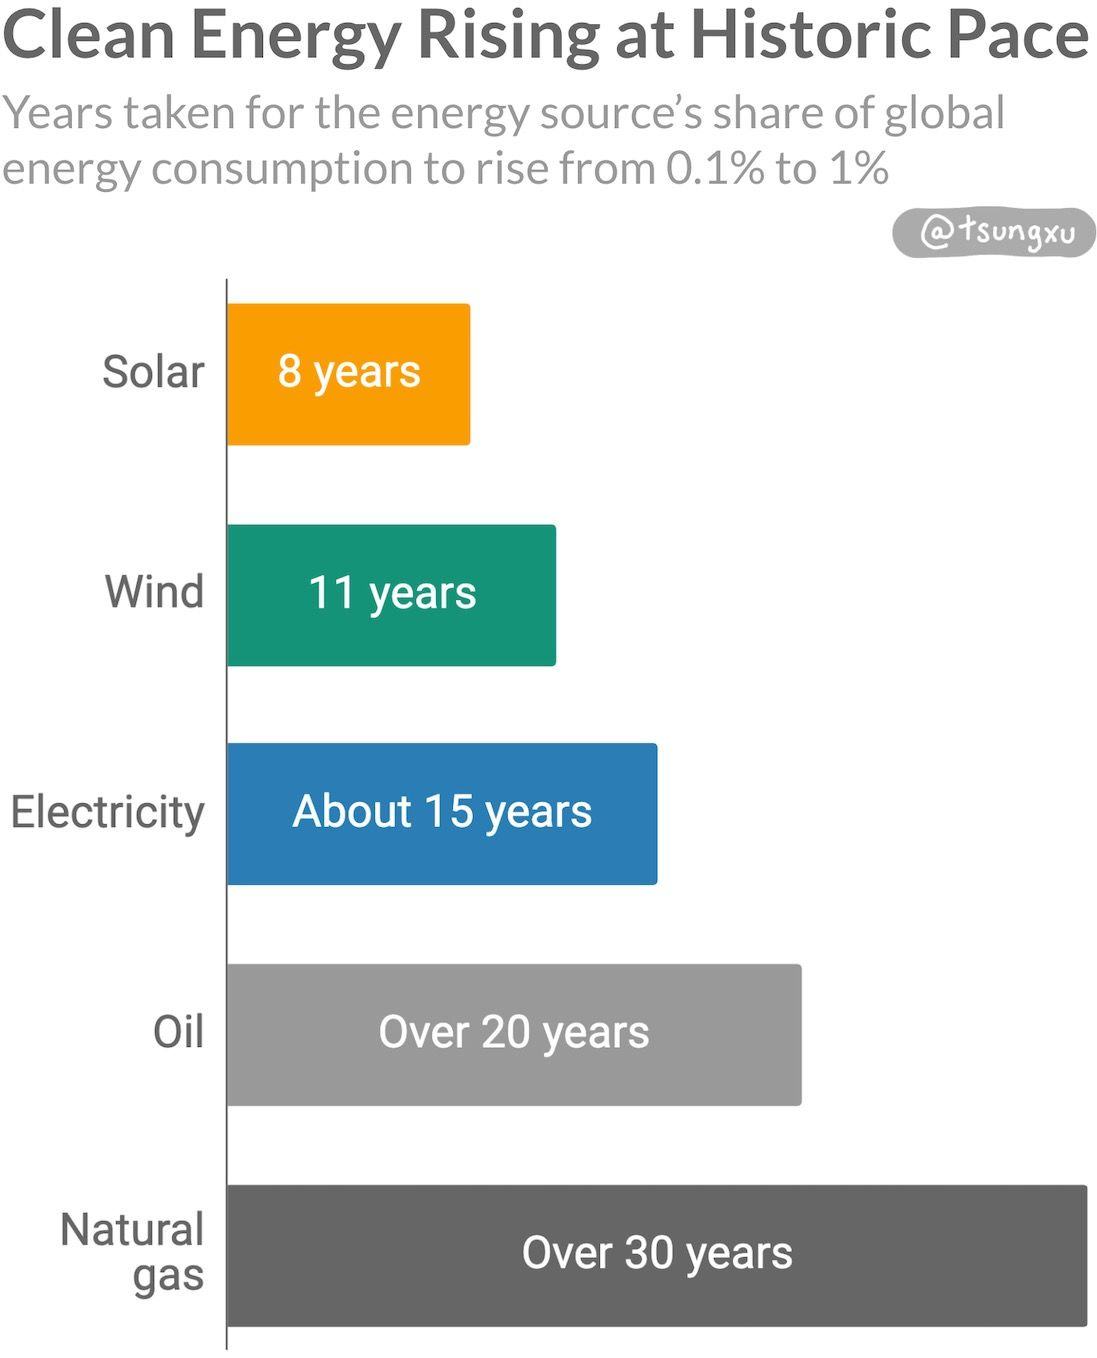
11Solar and wind exhibit steep and consistent learning curves (also known as experience curves). That is, they become cheaper to build as more units are built and used. This trait of rapidly scaling technologies has never applied to fossil fuel energy sources.
These clean energies show no signs of slowing down. The 2010’s were one of solar’s best decades, as shown in the chart below. Growth is strong, cost reductions drastic, and the industry is innovating and learning to further lower costs at speed.
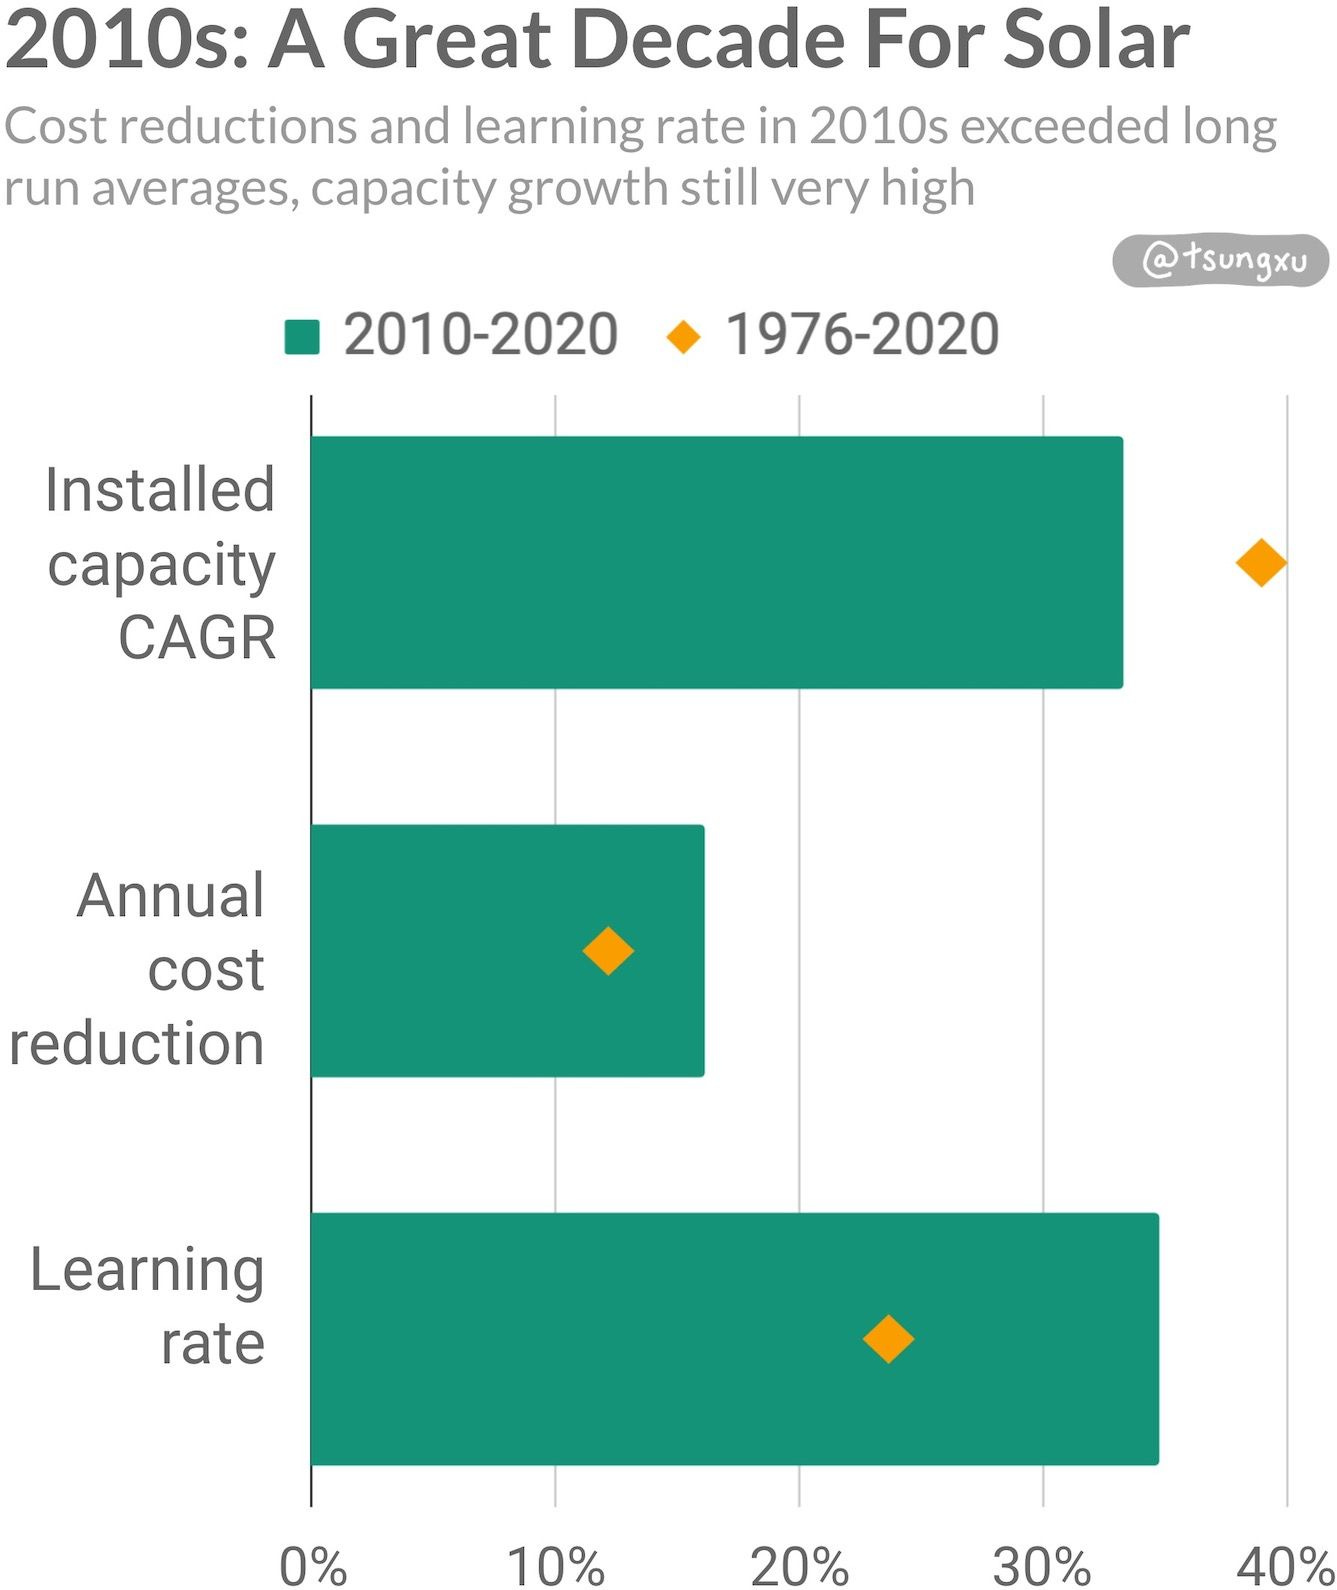
Installed capacity grew at over 33% CAGR during the decade. This is a blistering pace considering hundreds of millions of modules are being produced every year at this scale. Cost reductions were strong too, with the yearly fall in cost per watt was over 16% during the 2010s vs 12% over the last 44 years.
Finally, the learning rate, which is the rate of cost reduction for every doubling of capacity, was also much better than overall. Solar’s long run learning rate is about 23.6% since 1976, but this soared to almost 35% in the 2010s.
As we’ll discuss, even for optimist industry insiders this growth was unexpected.
There are positive feedback loops from combining technologies, as we saw in past transitions. We’re starting to see more solar plants being paired with lithium-ion storage, helping resolve many of the limitations of variable renewables. These two technologies are mutually beneficial and help each other scale. Analogs include the past transitions above: coal, iron and the steam engine; oil, steel and the internal combustion engine; electricity, aluminum and transmission lines.
Lets first look at how solar in particular has taken off to set the table for diving into the clean energy transition.
2.1 Solar Adoption: Slow, Then All At Once
Unless otherwise stated, stats and references in this section are from Greg Nemet’s How Solar Energy Became So Cheap.
Solar photovoltaics (PV) modules started off solving problems in small niche markets. As production ramped, costs came down and performance of modules kept improving. Solar kept entering larger markets, like the rooftop and later utility-scale power, which has continued driving strong growth.
Visualizing 40 years of non-linear growth
An important point to re-emphasize is how hard it is to grasp non-linear trends. Take solar since 1976. On average, module deployed capacity grew almost 40% per year while costs have fallen over 12% per year.12
What does this look like?
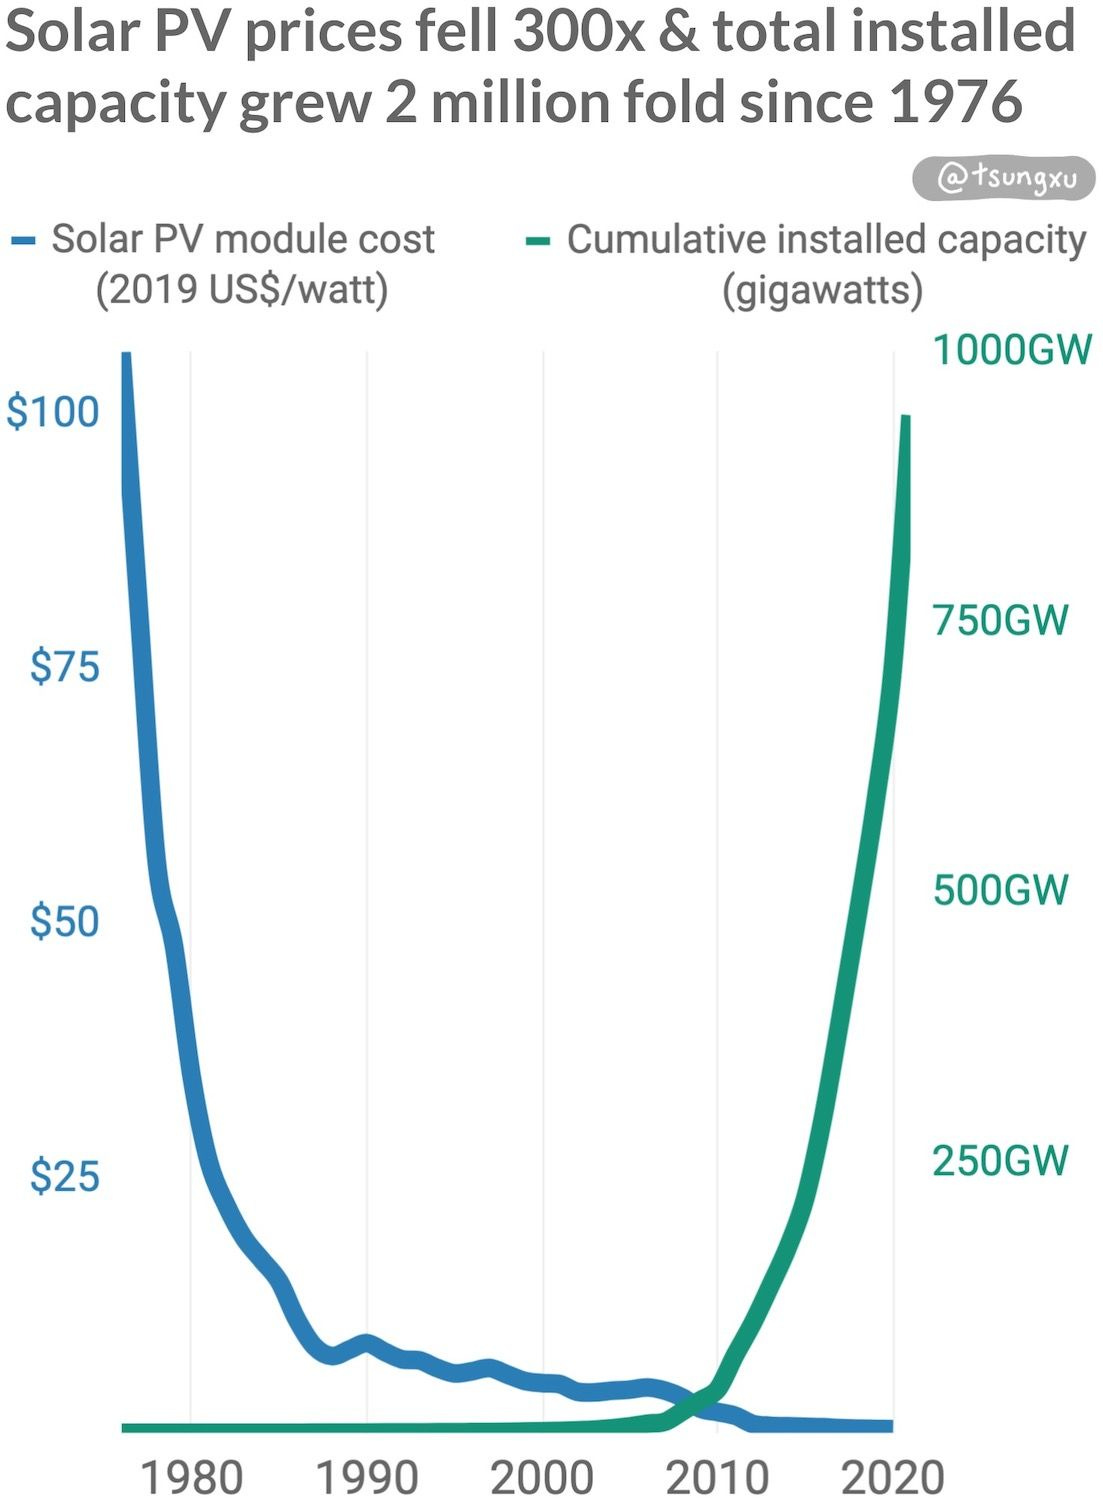
Solar’s growth is an excellent demonstration of the positive feedback loop we’ve discussed for manufactured technologies. Because fossil fuels are not manufactured technologies, costs do not consistently fall over a long period of time. Coal and natural gas plants do exhibit learning rates but the cost of the fuels themselves have trended up over the decades as easy-to-extract resources become depleted, driving operating costs higher.
Now if someone had just glanced at this chart, they might have assumed that the capacity of solar installed was basically zero until 2000. They might also think that solar module prices have been close to zero since the early 2010s.
They’d be wrong on both counts. The compounding growth and cost reductions drive massive changes in scale that are hard to read on linear axes.
There’s an initially harder to read, but much more useful way to express such large changes, as shown in this chart. Use log axes, make the x-axis cumulative capacity and mark time on the data series itself.
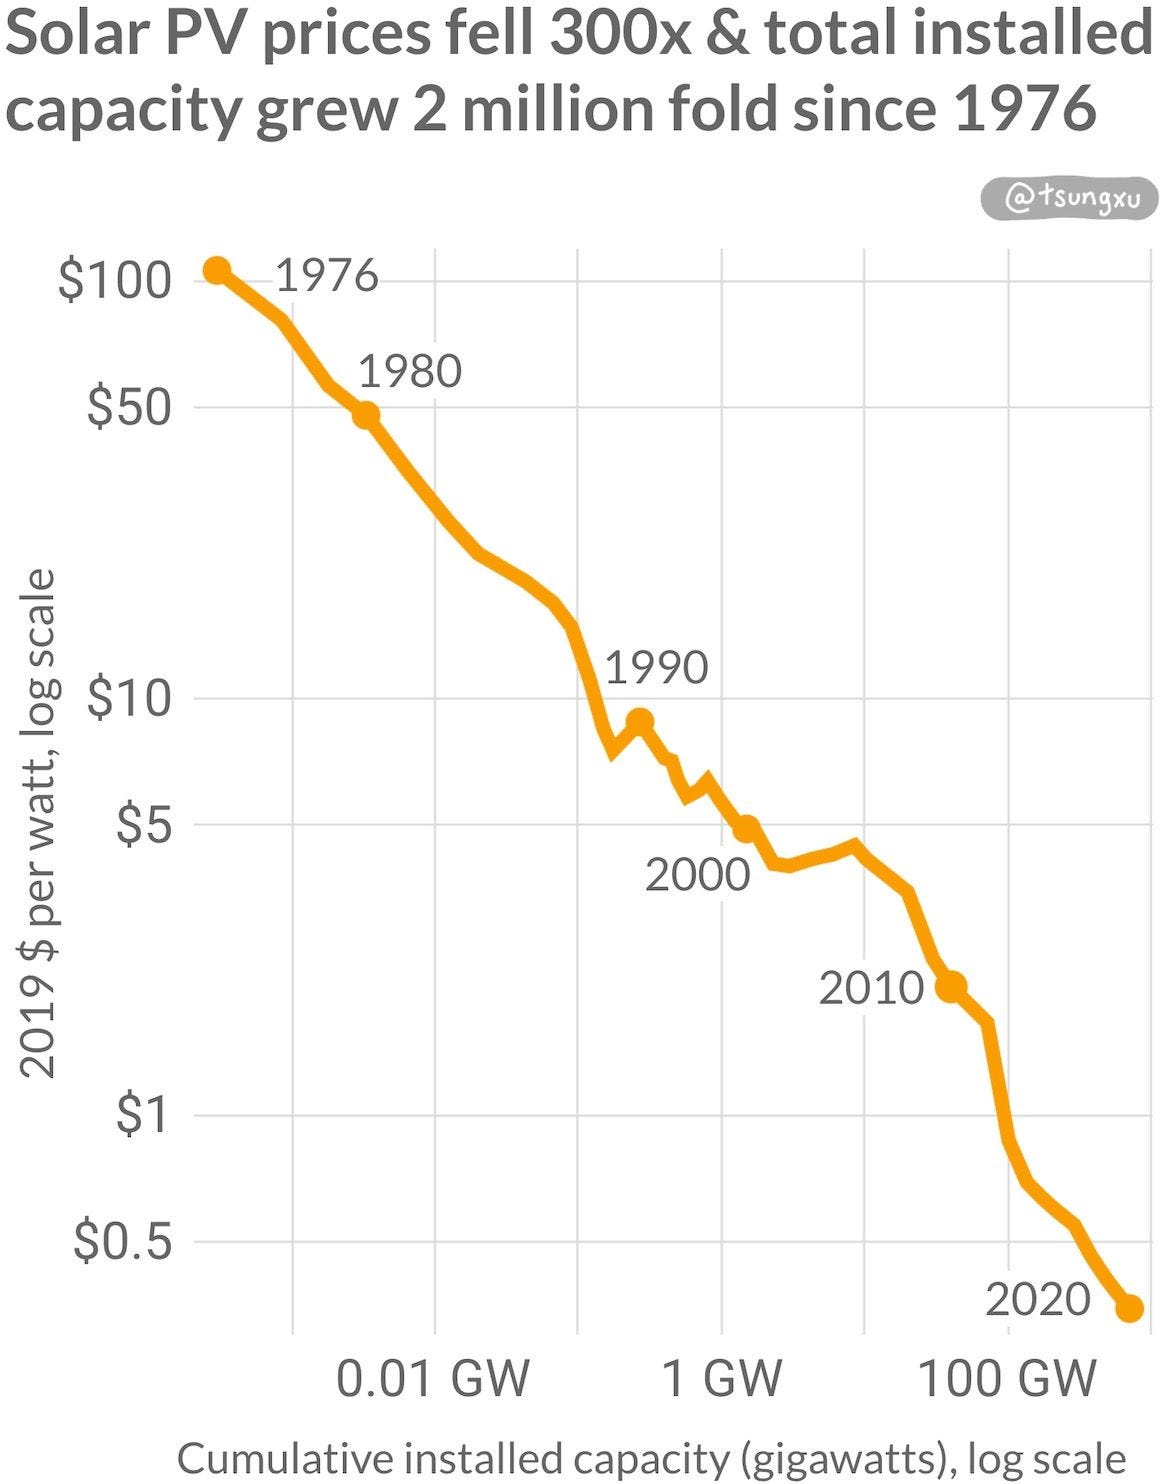
As we can see, solar’s growth and cost reductions have been very consistent over multiple decades, with some bumps (lasting a few years) along the way. The last ten years have seen the largest relative cost reduction ever. As we’ll discuss later, it does not look like solar’s growth is slowing down.
A short history of solar’s growth
In 1954, Bell Labs developed the first silicon solar cells. By the late 50s, early solar PV modules were used to power radio transmitters on US Navy satellites.
During the 1960s, the US government procured $150M for 10 million solar cells, as well as glass and solar PV components. They would also invest into solar R&D during the 70s as a response to the oil crises.13 This helped to drive down solar costs an impressive 5x from 1974 to 1981, despite still being a small nascent market with US industry sales only at $100M in 1982.
Through the 70s and 80s, Japanese companies like Sharp continued to find more niche markets for solar, such as lighthouses and consumer electronics — remember solar-powered calculators? They overtook US producers by the early 80s but had stagnated by the 90s when there were no larger markets to sell into.
Meanwhile California was gearing up to play a catalytic role in both solar and wind scale-up. There was newly introduced clean energy legislation and expectations of continuing oil price rises after the 1979 energy crisis. These allowed around a billion dollars of both wind and solar thermal projects to be financed and built before oil prices reverted.
In the 90s and 2000s, Germany would grow to become the biggest market for solar PVs at the time by far. Policy played a huge role, subsidizing over €200B of rooftop solar and accounting for over half of global PV installations during 2004 to 2010. German manufacturers like Q-Cells scaled up to serve the market, but by the mid 2000s, Chinese startups were rapidly taking market share.
In the early 2000s, China’s emerging solar startups executed faster and benefited from timing to scale up with the German market. Most importantly, they had a relentless focus on good-enough quality and low cost, which their German competitors did not. German manufacturers also had to develop more bespoke manufacturing equipment (often adapted from the semiconductor industry). But when later purchased by Chinese companies, the equipment had become more standardized and cost less.
The Chinese are better at building [solar PVs] than anyone. The US, Japan, and Germany were simply not fast enough to recognize the market opportunity, much less meet it… [Chinese companies were] hiring quickly, producing quickly, and improving quickly.
— Prof. Greg Nemet, How Solar Energy Became Cheap, Pg 135
From 2000-2007, in the first 7 years of some of the first startups launching, more solar PVs were installed globally by Chinese companies than by any other country. They raised $7B in IPOs during 2005 to 2007. Beginning in 2009, the Chinese government became very supportive of the industry, giving tens of billions in tax credits to solar manufacturers to accelerate scale-up.
Other regions with plentiful sunlight started to offer policy incentives. Australia and California offered feed-in tariffs introduced in the late 2000s, helping accelerate global adoption.
In 2008, a shortage and price spike in polysilicon, the main material for PVs, bankrupted many solar manufacturers. It also motivated overbuilding of capacity in the solar supply chain which then helped fuel the 2010s boom.
Since 2005, global installation capacity has been growing at a blistering 44% CAGR. Over 60% of the solar modules are made in China, a point that policy makers and manufacturers in the US and EU are now looking to change.
2.2 Falling Costs Have Opened Up Larger Markets
Electricity from solar and wind power are very cheap today.
Cost over the lifetime of an electricity-generating asset is calculated with the levelized cost of electricity or LCOE. Recall at the start of the post I mentioned tipping points for the cost of electricity from solar and wind.
We can show this new tipping point in the chart below. New project LCOE is cheaper than new-build natural gas, and is competitive with existing gas plants in the US. These clean energies have been cheaper than newly built gas plants for years — a previous tipping point.
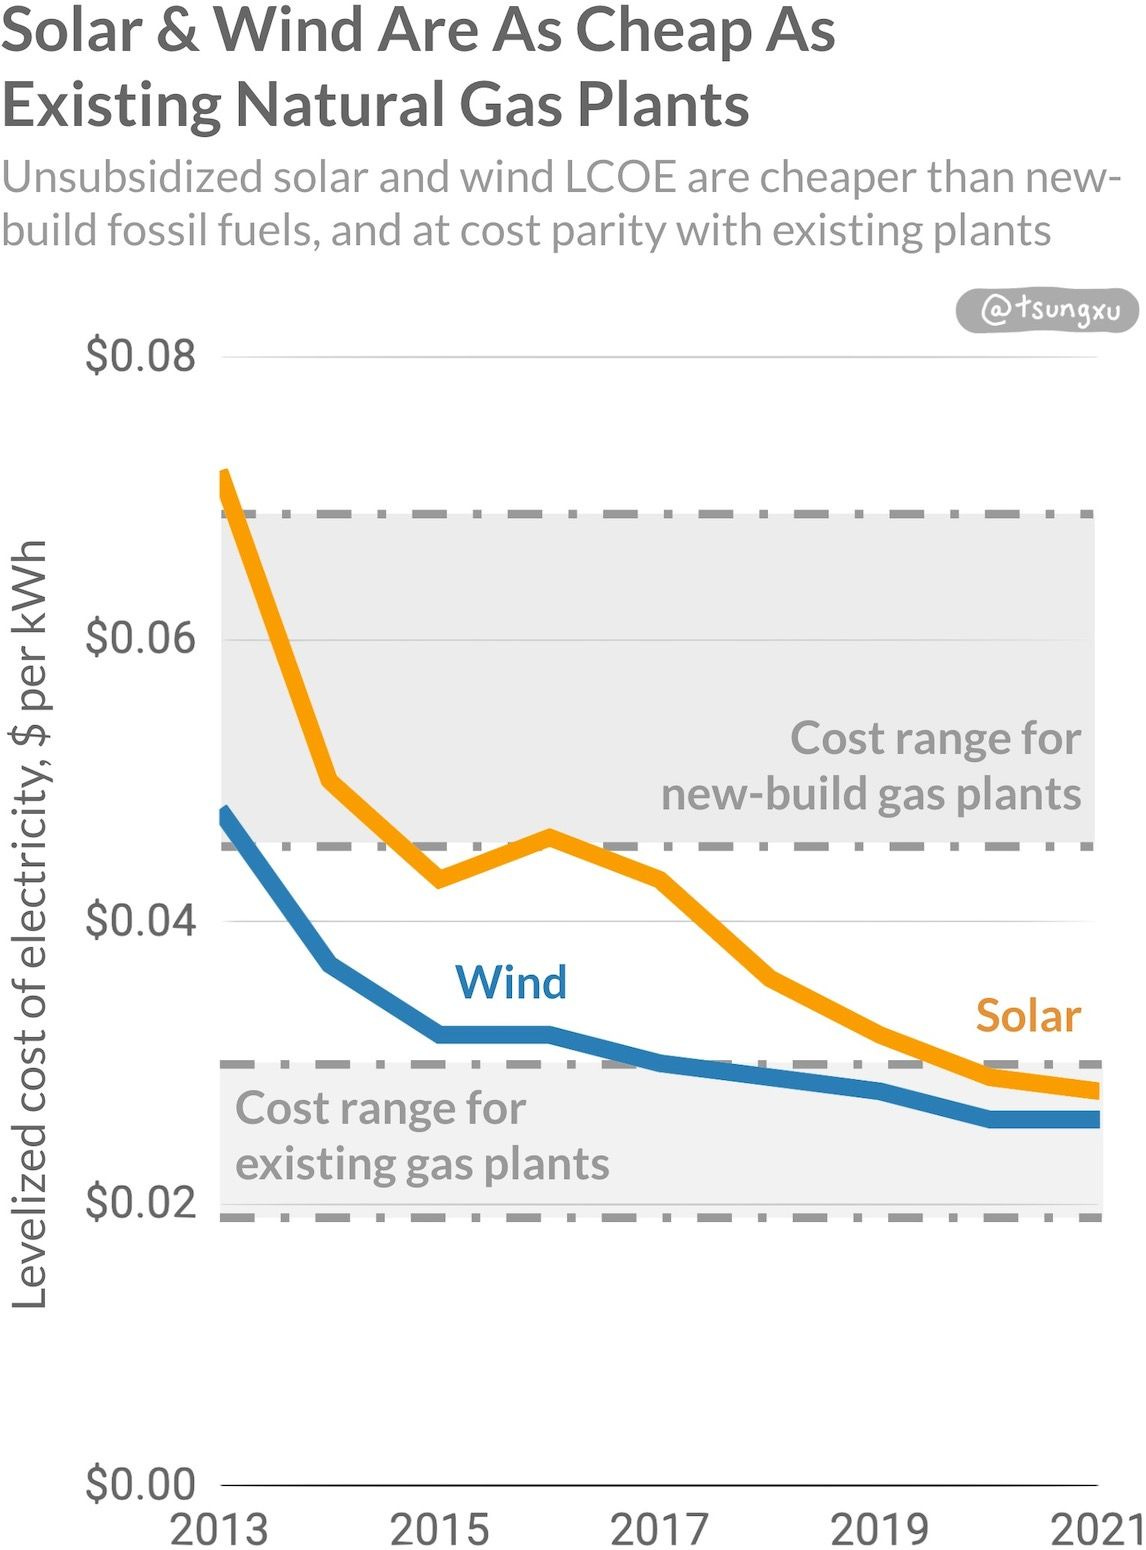
14In the chart above, the solar and wind LCOEs are unsubsidized. They are even more competitive with existing gas plants when taking current US incentives into account. With incentives, solar is five cents per kilowatt hour cheaper in 2021, at $0.023/kWh. Wind is incredibly cheap, falling fifteen cents per kWh to $0.009/kWh.
The LCOE of new solar and/or wind plants are competitive with, or even cheaper than, running existing coal or gas plants in many other countries. For example Australia, most of Western Europe, China, India and others. The cheapest fossil fuel plant is location dependent, and can be either coal or gas.
Reaching this cost tipping point has started to heavily discourage new coal or gas power plants from being built. In 2020 globally, 82% of new electricity capacity was from renewables.
In the US, no coal plants have been added since 2014 as shown in the chart below. Gas plants added only 10% of new electricity capacity in the first three quarters of 2021, compared to 57% only three years ago.
Learning curves for solar and wind are global, so that more deployments in early-adopting countries help bring down costs for others. This is great news for developing countries too, where solar’s growth is also accelerating.
India increased its solar capacity 600x between 2010 and 2020, and is currently only behind China, the US and Japan in total installed capacity. Vietnam added more solar capacity in 2020 than every country except the US and China, as foreign banks shun coal there (as they’ve done in many countries).
2.3 Solar’s Growth Keeps Being Underestimated
Solar PV has sustained high learning rates. Since 1976, every doubling of solar capacity has led to 20% reduction in cost, driving 300x price fall as capacity scaled 2 million times.
This is an example of Wright’s Law that describes a consistent fall in cost for every doubling of production. It’s been observed for making everything from airplanes, the Ford Model T, semiconductor RAM, and lithium ion batteries. Wright’s Law may even be better suited for predicting semiconductor production than Moore’s Law.
Almost no one has been optimistic enough about the speed of solar’s growth and cost reductions. This is despite Wright’s Law holding well for solar over more than four decades.
An Oxford team recently analyzed historical forecasts for solar PV, wind and other energy transition technologies. Not surprisingly, models consistently underestimated the growth of solar as well as the speed of continuing cost reductions. In their working paper, they wrote:
“Such models have consistently failed to produce results in line with past trends.”
They concluded, not surprisingly given solar’s rather consistent learning rate that:
“In contrast, forecasts based on trend extrapolation consistently performed much better.”
What about the predictions of industry founders, insiders, and experts?
Gregory Nemet, author of How Solar Energy Became Cheap, wanted to see. Between 2008 and 2011, he asked 65 leading solar business pioneers, policy makers and academics to predict the cost of solar in 2030.
In 2018, reality had already exceeded the expert forecasts twelve years early. The cost of solar-powered electricity was already lower than the median predictions for 2030. Remember, these were not pundits, but people who had built the industry.
The IEA, the world’s leading energy body, and leading energy experts have consistently underestimated solar’s growth for the last 20 years. What has happened to solar’s cost in the last 10 years was over a decade ahead of expert predictions.
Why have models and experts been so wrong?
I think in short, solar has expanded into larger markets faster than anyone thought possible. Alongside that, it has continued to drive cost reductions in the process, even accelerating in the last decade.
As the Oxford team discussed, forecasts used arbitrary limits to growth rates not consistent with historical patterns, and just as arbitrary “floor costs” that were baked into models.
The learning rates for solar have been faster since 2010 than in previous decades. As discussed earlier, learning rates in the last decade were almost 35%, above the long-term average of 24% since 1976.
There are several reasons why the LCOE of solar has been falling even faster than the historical average. Solar PV technology keeps improving as production ramps.
One group who clearly did not get the forecasters’ slow-growth memos were the solar manufacturers. They increasingly benefit from economies of scale and standardization in manufacturing. Solar projects are increasingly being built at utility scale, which are now up to multiple gigawatts in size. This has enabled even more cost reductions with lower non-module costs for utility scale solar projects. Finally, solar PVs are becoming more durable with longer warranties being offered over time, with one large manufacturer now offering 40 years.
2.4 Intermittency
Intermittency is the problem of the sun not always shining, and the wind not always blowing.
As more solar has been added to grids like California’s CAISO and South Australia, there can be sunny days with too much solar for the grid to handle (the duck curve phenomena). In grids with high solar penetration like the two mentioned, it creates a need for resolving daily intermittency.
There is also the problem of longer-duration intermittency which can be for several days or seasonal mismatches. In an area where one winter is particularly cloudy, solar capacity can fall by half or more over a month vs the yearly average.
Solutions are at hand though. For shorter durations, big lithium ion storage projects provide up to four hours of viable storage for renewables with current unit economics. Eight hour storage projects are starting to appear. The first grid-scale deployment was by Tesla in South Australia in 2017, with the state having not endured a blackout nor needing to “shed” any clean energy since then.
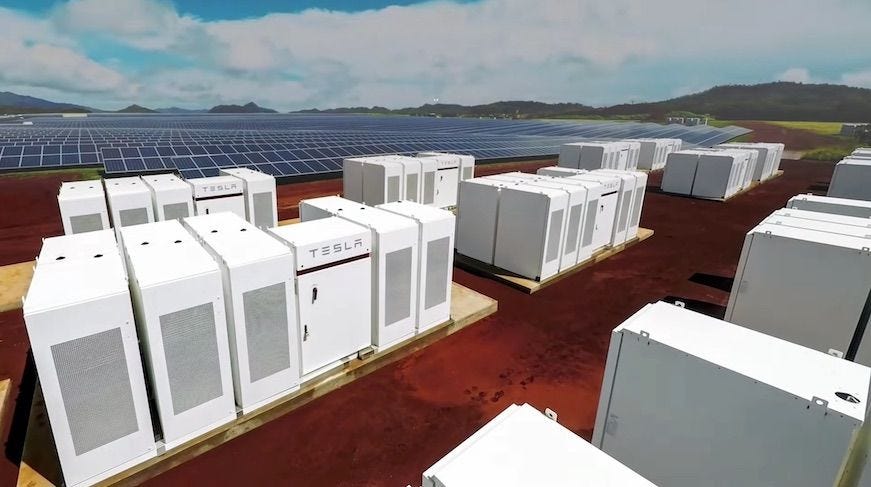
Storage paired with solar can add more value to high-renewable grids than storage alone, especially during peak evening hours. Also, as battery prices continue to fall, longer duration storage, perhaps 12 hours will be possible. We will talk more about batteries and the storage market in the next section.
Longer duration storage has many clean energy solutions like pumped hydro, mechanical and various electrochemical solutions like iron-air batteries. There’s no shortage of funding for these emerging technologies. It’s still too early to tell which technologies will scale, but likely those that use low cost materials and have high learning rates.
Finally, the grid might not need as much storage as you’d think, though we will need a lot.
A recent paper published in Nature models that if solar and wind provide 1.5x of all electricity capacity, only 3 hours of paired battery storage would perform well. It would result in electricity shortages during less than 200 hours per year. Likely even less shortages would have been modeled if distributed batteries (say in electric vehicles) were included in the analysis.
2.5 Transmission upgrades
Transmitting utility-scale clean energy from solar or wind-rich areas requires more high voltage transmission lines to be built. These lines are often expensive, and get bogged down in permitting red-tape that can take 10 years for approval and deployment.
Of course, we only need transmission lines in cases where clean electrons are generated far away from where they are used, like urban centers and manufacturing hubs.
To move faster and get access to cheap, clean electrons directly, electricity-hungry industries are increasingly co-locating next to solar and wind plants. This way, renewables developers avoid paying interconnection fees whilst new industries powered on ultra-cheap electrons can get the cheapest juice possible without a utility acting as middleman. We’ll talk more about this later.
The other side of this is of course, installing smaller-scale solar projects in areas where energy is already used. Rooftop solar, microgrids and energy storage for homes and industry are growing. These distributed energy resources (DERs in energy-speak) can keep the lights on during extreme weather events even if all power lines into a city go down.
In many scenarios, more transmission does need to be built. To enable more utility-scale solar and wind power requires reform and infrastructure upgrades. This space has seen promising activity by US regulators recently and bills that allow for faster transmission buildout along roads and railways. There are also startups working on increasing the capacity of existing lines and optimizing them.
In reality, most countries are scaling both distributed and utility-scale clean energy as both types offer value in addition to being low carbon.
2.6 Strong Growth Ahead Is Likely
Solar and wind power are likely still very early in their adoption and will continue to see strong growth. The following points make my case.
Solar and wind keep driving down costs as deployment scales
The cost of solar-powered electricity has declined 35% per industry doubling in the last decade. The learning rate is faster than the 24% rate seen since 1976, but makes sense given the rapid growth and competition of Chinese manufacturers since the mid-2000s discussed earlier.
No physical cost constraints for at least the next decade
There is plenty of land and materials like silicon for scaling up solar PV production. Newer panels are built to last longer. Solar PV technologies are still maturing, with room to drive down costs further. Examples include increasingly standardized manufacturing, better materials that improve cell efficiency and designs such as bifacial or double layer with higher efficiencies, and even anchoring panels directly to the ground to save on system and labor costs.
Looking at the last decade, the CAGR of solar-generated electricity was almost 40%, which outpaced the growth in annual capacity additions of just over 33%.15 This likely was helped by improving solar capacity factor from an increasing number of utility-scale projects using sun trackers as well as more efficient solar cells and otherwise improved manufacturing processes.
Solar and wind outcompete fossil fuels in many places
New utility-scale solar or wind projects are already cheaper than running existing coal and natural gas plants in countries making up 46% of the world’s population. As shown in the chart below, solar is cheapest for China, India and most of Western Europe; wind in Denmark, Brazil, UK, Morocco and others. In the US, 61% of existing coal plants are more expensive than renewables. Solar and wind are competitive with running existing natural gas plants.
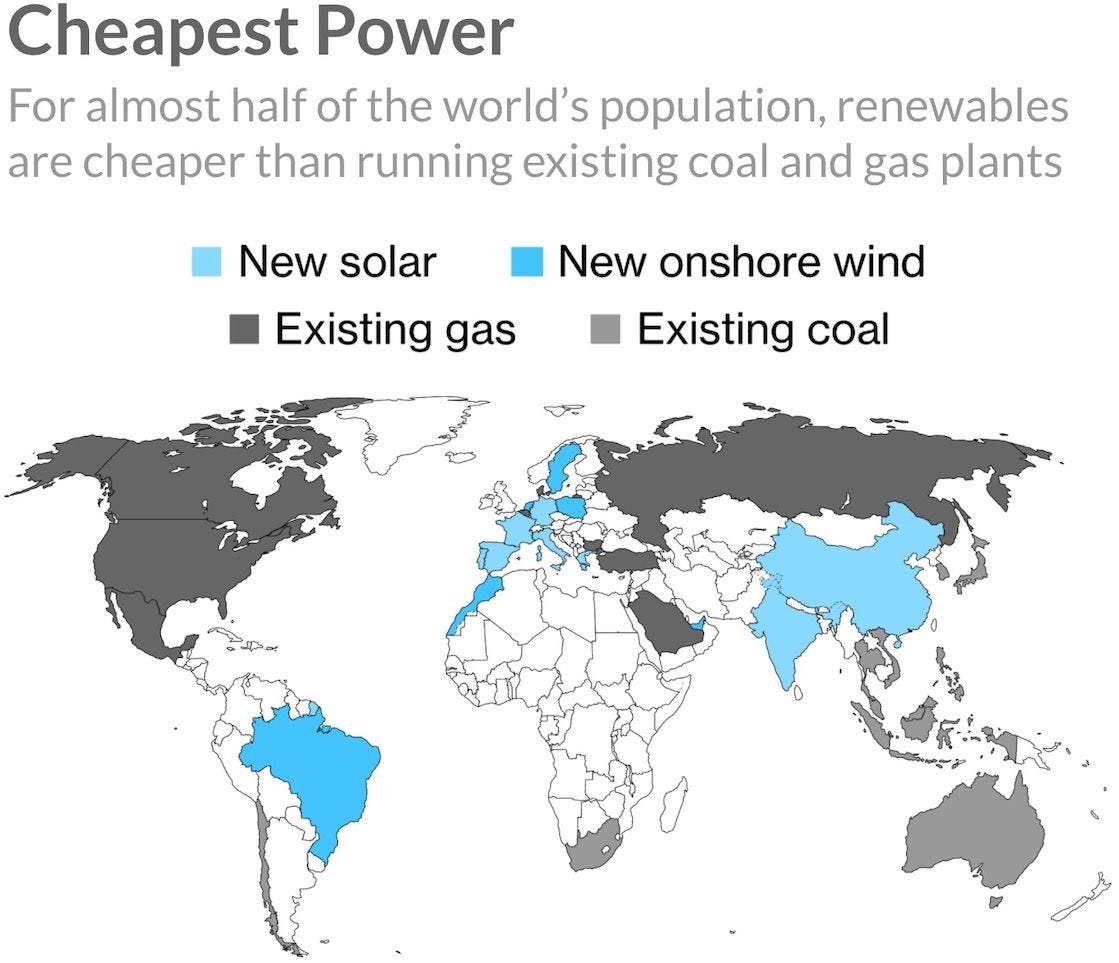
As mentioned before, 82% of new electricity generation globally was from renewables in 2020. Coal is in near terminal decline, with proposed plants being canceled at a historic rate. Natural gas use for all uses including electricity, fuel and heat may have peaked in the US in 2019. The decline of gas for electricity generation likely will be accelerated by the late 2021 global spike in prices. As solar and wind become the cheapest source of electrons in even more countries, expect an increasing amount of stranded existing fossil assets.
The case to shut down and replace existing fossil plants becomes more and more compelling every year.
Distributed solar and offshore wind reduce need for transmission lines
As mentioned in 2.4, transmission upgrades are costly and take many years to even approve new utility-scale solar plants.
Distributed solar can complement utility-scale renewables. Types include residential rooftops, commercial and industrial, microgrids and offsite community solar installations.
Distributed solar, batteries and other resources can actually reduce grid electricity costs and even enable more utility-scale renewables to be built.
Solar PVs, by design, are small and modular enough to be deployed near or where it is used. Rooftop solar has boomed in countries where solar resources are great, system costs are cheap, net metering policies means high ROI, and permitting processes are fast. For example, 30% of Australian homes have already installed rooftop solar, and by 2025, solar will supply all the needed electrons at times.16
The US is a country in which rooftop solar is unnecessarily expensive. A combination of permitting costs and city-level red tape, arcane code restrictions and very high customer acquisition costs have made rooftop solar in the US far less affordable. Which of course means far less adoption. In contrast, Australia has streamlined permitting, simplified codes and lowered customer acquisition and labor installation costs. The result? Rooftop solar is almost three times more expensive in the US. The US does seem to be making inroads to reduce costs and friction though, with the SolarAPP public/private initiative to automate permitting, and California looking to pass its own bill to build on SolarAPP.
There are more rooftops being added just to enable more solar-generated electrons. EV charging stations are starting to add covered carports with solar PV rooftops, and stationary batteries. This makes EV charging sites more economical by allowing businesses to avoid demand charges, which can make up half of an energy-intensive business’s utility bill. It also allows restaurants and other commercial spaces to adopt microgrids, saving on electricity costs and having backup energy during outages.

Community solar is another promising type of distributed energy. It covers a broad umbrella of solar installations that allow the financial benefits to be distributed amongst many people. These projects could allow two third of Americans and billions globally who can’t install rooftop solar to access local clean energy. A huge benefit is community solar does not usually require transmission upgrades. US community solar capacity grew at 130% CAGR during 2010-2020, far outpacing even the overall stellar rise in solar.
Offshore wind turbines can also help alleviate transmission challenges, being located near energy-hungry coastal population hubs. Capacity of global offshore wind farms rose 11x from 2010-2020 (27% CAGR). Even more growth is ahead, with nine times the amount of current capacity in the pipeline, as shown below. Wind speeds at sea are higher, more consistent and often peak when most needed during afternoons and evenings.
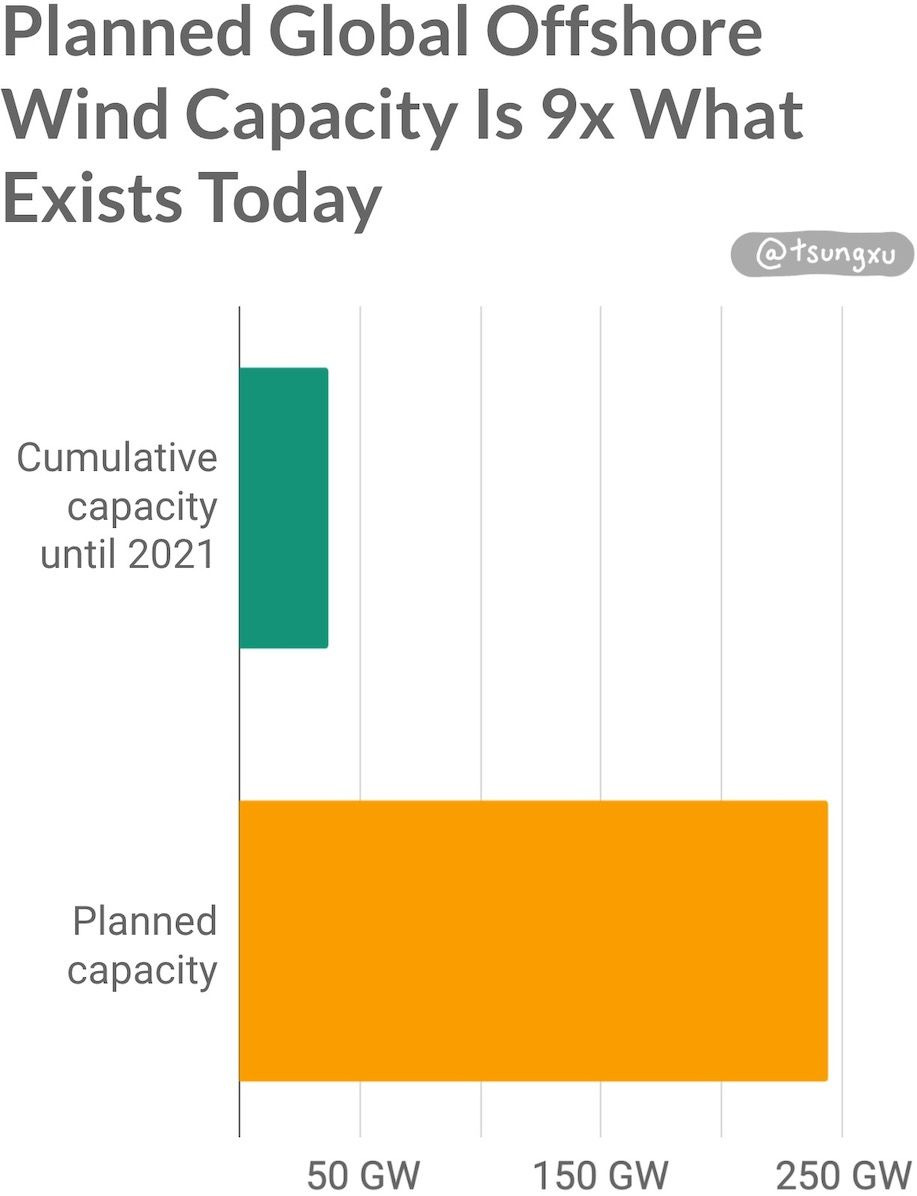
Wind power will continue getting cheaper. Electricity costs from offshore wind globally have fallen by nearly half in 10 years, with a 9% fall in 2020 alone and auction results suggest another 40% fall by 2023. In the US, the booming queues of offshore wind projects are very promising, but require some transmission issues to be resolved. Finally, offshore wind resources are especially abundant closer to Earth’s poles, making them very complementary for equator-favoring solar power.
Not to be outdone, onshore wind turbines at end-of-life can be repowered. This means much of the structure can be reused and new turbines be installed, saving on costs and eliminating lengthly interconnection delays and costs. This has already been happening in Denmark for example.
New uses for solar PV will continue to be found. We tend to think solar PVs will only be used to produce electricity. But we will likely see more novel uses and integrations as solar keeps getting cheaper.
One example is the growing momentum for building-integrated PV (BIPV) systems. These systems can replace existing facades, like for the Swiss building in the photo below, or replace rooftop tiles/shingles (think Tesla’s solar roof).

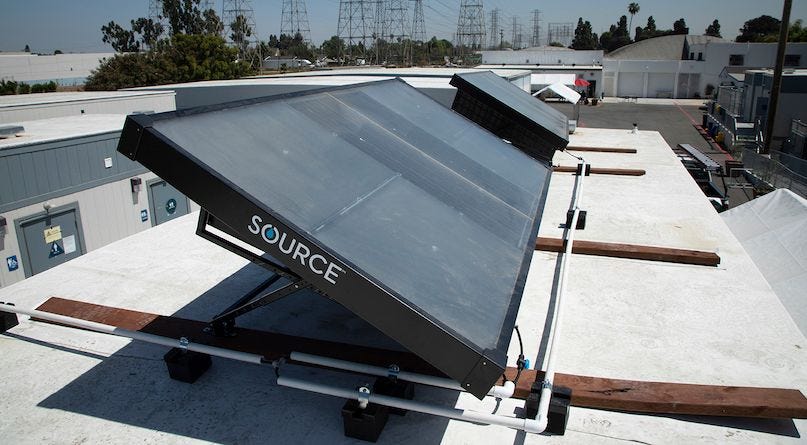
Another example is solar PV that can produce water. Source Global deploys “hydropanels” that make clean drinking water using solar PVs to condense water vapor. It is being used for remote communities and for water conservation in drought-stricken areas like California’s Central Valley.
2.7 What About Nuclear Fission and Fusion?
Nuclear power has tremendous potential, and the promise of abundant fusion power is worth accelerating R&D into.
There’s a lot of chatter amongst some Silicon Valley engineers and Twitterati about the promise of nuclear energy, which I in part agree with. Yet they have, like most everyone else, vastly underestimated the growth of solar and wind and some have acknowledged this more recently.
Around 10% of the world’s electricity is generated by large (gigawatt scale) nuclear fission plants. That sounds like a lot, but it has fallen from a high of over 17% in the mid 90s, mostly because of increasing public safety concerns over meltdowns like Fukushima, Chernobyl and Three Mile Island. Cost blowouts and cancellations have made large nuclear plants uncompetitive with solar or wind energy.
Despite these accidents, current generation nuclear power is very safe. In fact a hundred times more so than fossil fuels. Small modular reactors (SMRs) and next generation designs are likely to be even safer. However, these emerging technologies still face long project delays and cost concerns for buyers especially in developed countries. Other countries show some more promise, with NuScale, a leading SMR company, having plans to build an SMR plant in Romania by the late 2020s.

A promising strategy may be to carve out a compelling niche, avoiding competing on price with low cost renewables. Micro-reactors like Oklo are targeting remote communities that rely on diesel whilst NDB is developing tiny nuclear waste-powered batteries for consumer electronics that never need charging.
As for fusion, more R&D is a no-brainer. Rather than using a tiny fraction of sunlight emitted by the sun’s continuous fusion reaction, we should be building our own safe mini-star fusion reactors. A key step to progress fusion is a demonstration plant producing more energy than it uses. As dozens of well funded companies and public consortia resolve the early technical hurdles, progress has been promising.
Despite the R&D progress, the technology is still likely still at least two decades away from commercialization. By then, as we’ve shown, it is likely solar, wind and batteries will be so cheap as to make it very hard for early commercial fusion designs to be cost competitive in generating electrons. A possible path for fusion in the 2040s or 2050s would also be to scale up in niche markets, perhaps where heat can be directly harnessed.
It is inevitable that fusion, next-gen fission and/or other clean energy technologies will largely replace solar, wind and batteries one day. That’s the nature of energy transitions as we’ve seen.
3 Storage: Batteries, EVs and More
Lithium-ion batteries (LIBs) may be the most underrated technology today.
For years, LIBs have powered our phones, electronics, power tools and even pacemakers and hearing aids.
They run quietly and reliably in the background but it’s hard to imagine living in a world without them. Since they were commercialized only thirty years ago, these batteries have become something we take for granted,17 but already power so many tools we depend on.
LIBs are still in the early days of growth. Prices have tumbled over 97% since 1991, and continue to fall. Battery capacity has risen by over 6 orders of magnitude in that time, with the learning rate being about 18.9%. I.e. prices falling that much for every doubling of production. Sounds like solar’s growth right?
Many developments in technology and processes have continued to improve energy density and cycle count. Gravimetric energy density is up over 3x from ~80 Wh/kg in Sony’s original 1991 design to now almost 300 Wh/kg. This allows battery makers to offer 6 year and 600,000 km (370,000 mile) warranties on their batteries, and Tesla has said their Model S/X batteries still average 90% capacity after 200,000 miles.
Enabled by these improvements, growth is accelerating for these large, linchpin LIB markets. In 2021, EV sales more than doubled in just one year. US storage deployment is set to more than quadruple in 2021, after tripling in 2020!
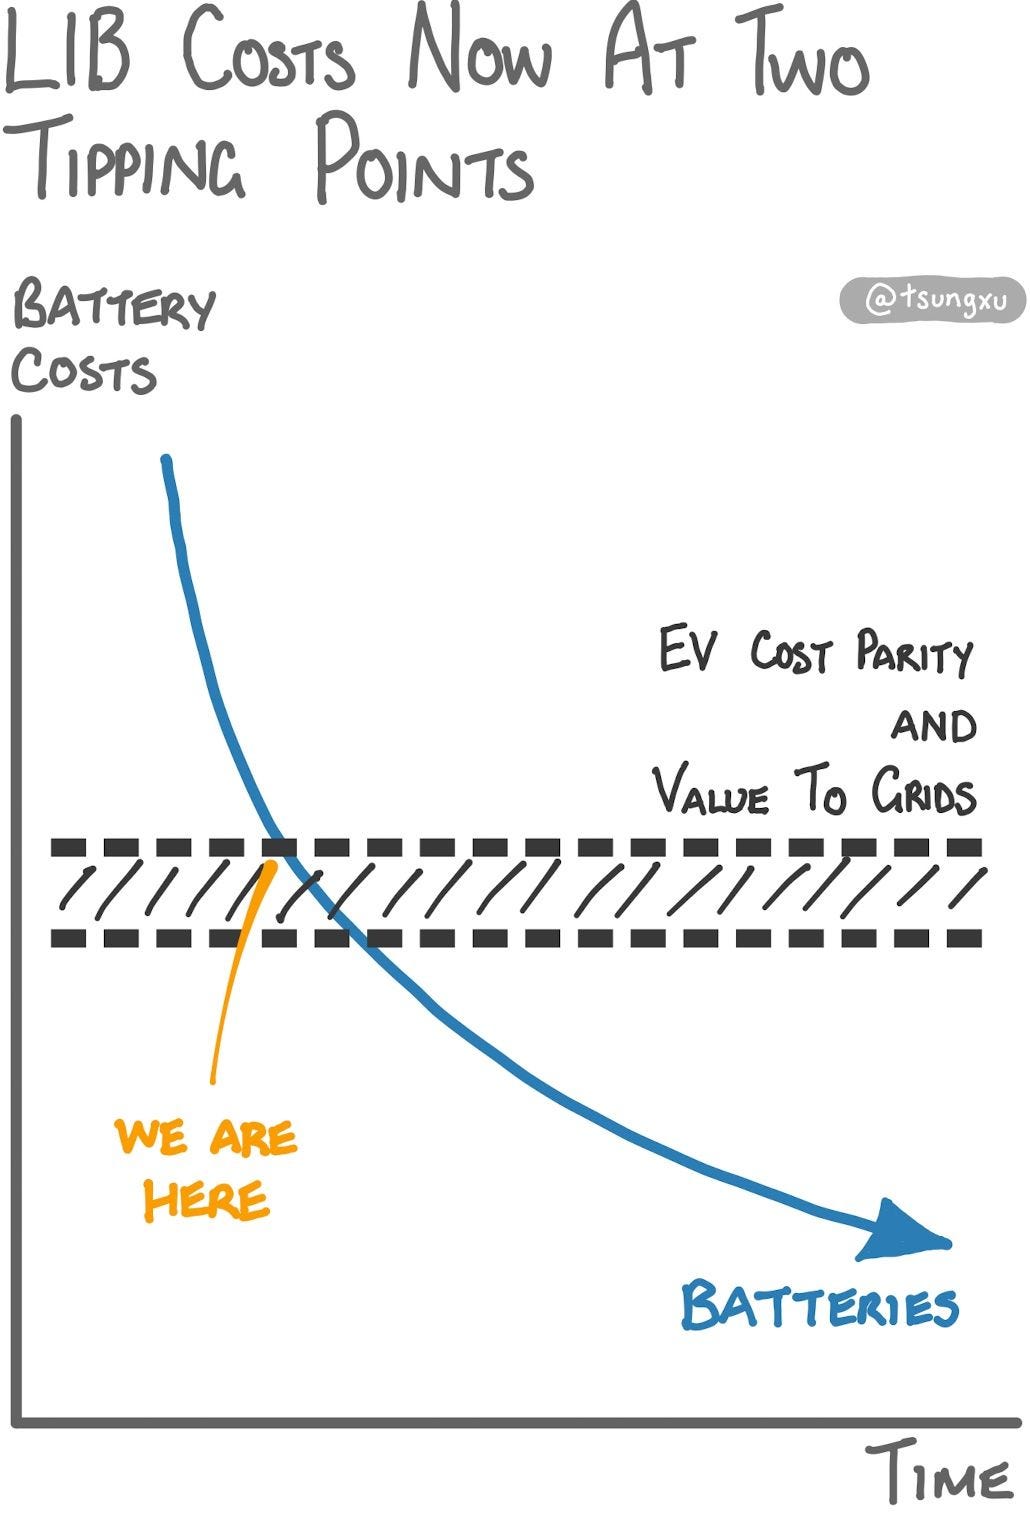
In both battery markets, the rapidly falling cost of batteries have reached tipping points. They are increasingly allowing ICE car cost-competitiveness for EVs. Also, the cost reductions enable more economically viable deployment of grid storage either as standalone sites or (increasingly) paired with solar.
3.1 LIB Adoption Is Even Faster Than Solar
The rise of LIBs has been simply extraordinary so far.
John Goodenough, then at Oxford, developed a proof-of-concept in his 1980 research with cobalt oxide as a stable cathode. Five years later, Akira Yoshino developed a commercially viable battery based on the work of Goodenough and others. His employer and Sony would commercialize in 1991, initially in a bestselling camcorder, which its competitors like Panasonic quickly copied.
In the 90s and early 2000s, LIBs cornered the market for portable electronics, expanding into laptops, mobile phones, iPods and more. Costs plummeted, as you can see in the chart below. This market continued to grow as battery energy density improved. Not long after, lighter and more power-hungry devices like drones started hitting shelves and battlefields.
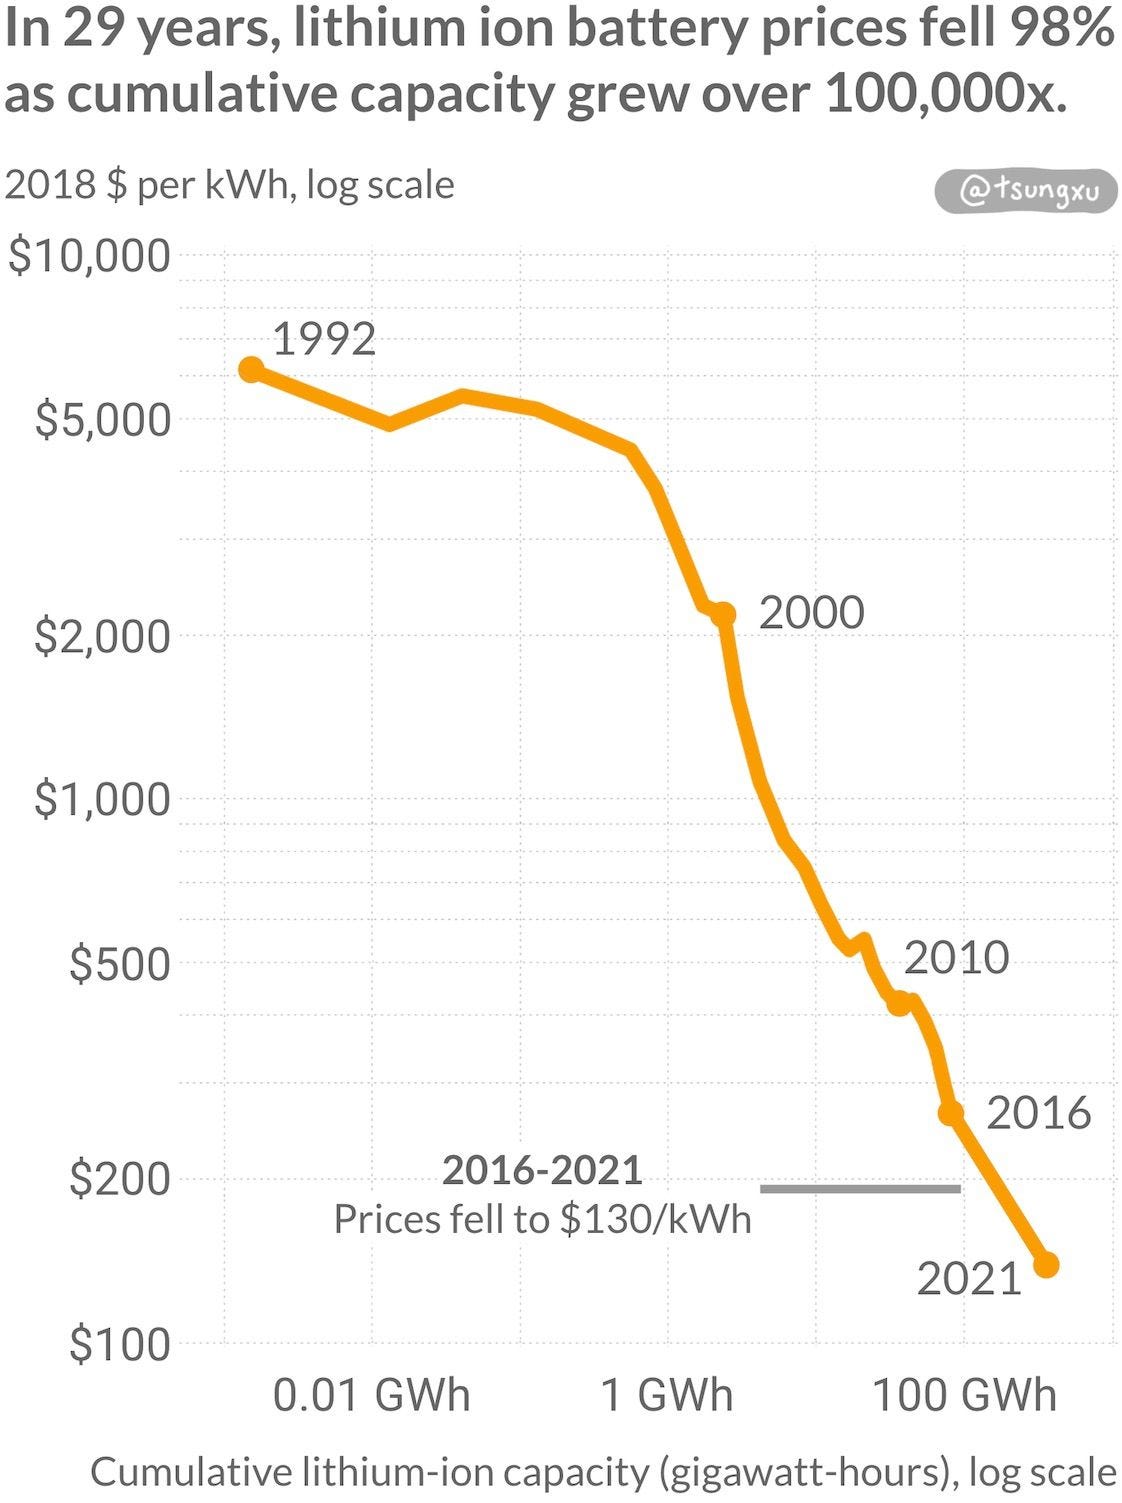
By the mid-2000s, cost reductions slowed as saturation in the consumer electronics market slowed growth. People were not buying new tech gadgets as quickly as they used to. Also, the small size of each device’s battery was contributing less and less to LIB deployment over time.
This changed with the rise of electric vehicles (EVs). The first LIB powered EV was Tesla’s Roadster. It launched in 2008 using existing reliable existing 18650 sized battery cells. These cells, assembled into custom battery packs, were actually designed for laptops — no batteries were built for EVs specifically at the time.18 Portable electronics literally provided the first batteries for commercializing EVs. Now, a Tesla Model 3 has the capacity of about 4000 iPhones.
The equally interesting, but less often discussed side of LIBs is how production scaled. Chinese battery cell manufacturers achieved 73% of global production in 2019. By then, the Chinese had rapidly surpassed Japanese (remember Sony?) and South Korean manufacturers who had previously led. They did this by focusing on the booming EVs and storage markets, and not electronics. Generous government incentives and policies dating back to 2009 also helped tremendously. Unlike the scale-up of solar manufacturing there, the public sector took more initiative in developing the battery supply chain before winners emerged.
No surprise: this growth has been underestimated
Much like solar, LIB prices have fallen twice as quickly as “optimistic” forecasters like BNEF and Navigant predicted. This has driven underwhelming estimates in the adoption of EVs and energy storage.
Let’s first look at EV forecasts. In 2015, the US Energy Information Administration (EIA) predicted that only 20,000 EVs with 200+ miles of range will be sold per year by 2040. In September 2021, the US sold almost 30,000 EVs in one month. In the last 5 years, BNEF and others just keep raising their projections for EV sales. Not surprising.
For energy storage, Wood Mackenzie, a leading energy consultancy, made a forecast in 2018 for US sales in 2023 to be $4.6B. Only three years later in H2 2021, they had to raise it by two thirds to $7.6B.19
It’s really hard for people to grasp how quickly high learning rate technologies like solar and LIBs can grow. Even Tesla has been surprised by the recent growth in demand for EVs.
3.2 EVs Are Rapidly Replacing ICE Cars
“There appears to just be quite a profound awakening of the desirability for electric vehicles. And to be totally frank, it’s caught us a little bit off guard… we’re not able to increase production capacity fast enough.”
— Zachary Kirkhorn, Tesla CFO (aka “Master of Coin”)
EV market growth is exceeding most expectations.
In 2021, people buying EVs are no longer just eco-warriors or Tesla fanboys. There are more and more reasons to buy an EV car like price, performance, cheaper cost of ownership, range, improving charging infrastructure and more EV models every year.
As you can see from the chart below, global EV sales keep growing, with 2021 being an inflection point.
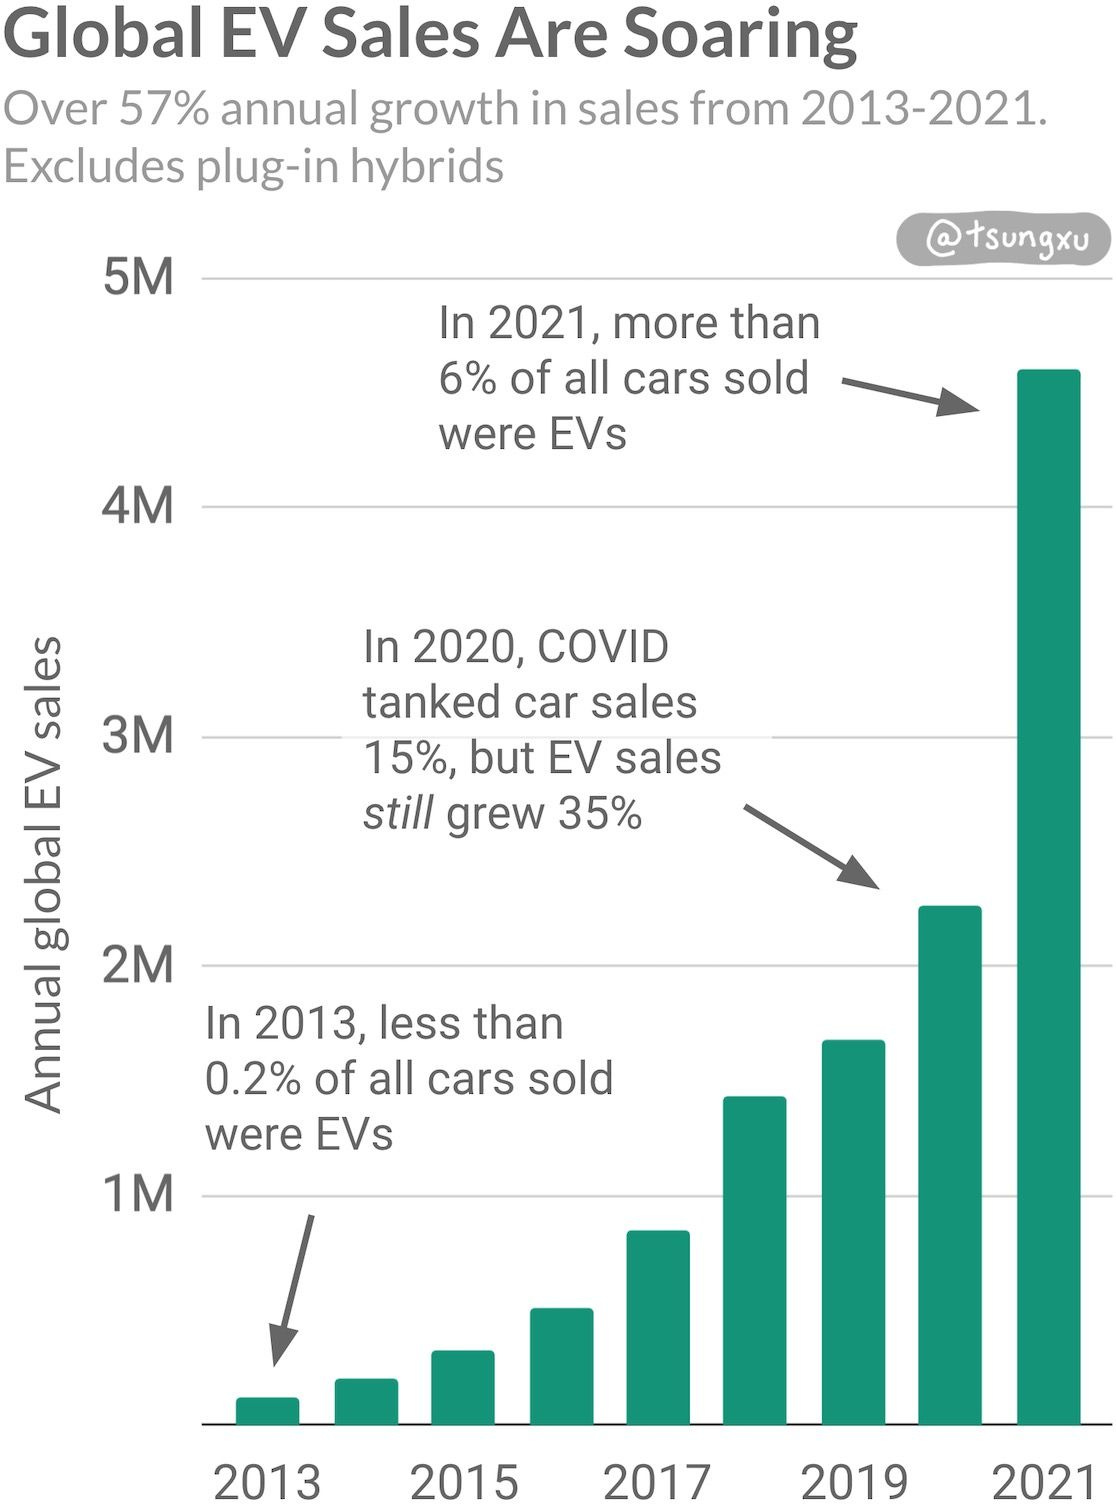
Light electric vehicle sales globally have grown 57% every year from 2013 through 2021. There’s around 12 million purely electric passenger cars on the road in 2021. Around 4.3% of global car sales in the first half of 2021 were fully electric.
Growth is so rapid that every month, EVs are taking share from ICE cars. Leading the way in December 2021 were Western Europe with 20% and China with 17%. These markets led with far more vehicle selection and policy support vs the US other markets. The US is a few years behind at current growth rates, with EV’s making up less than 3% of 2021 passenger vehicle sales.
We’ve already talked about the dramatic fall in LIB prices. However, they do still account for about 30 percent of the cost of an EV, and have plenty of room to come down as learning rates continue. Upfront purchase cost is already competitive with ICE vehicles, with government incentives, particularly in China where EV market competition is fiercest.
Within a few years, EVs will reach price parity without incentives as battery prices keep falling. Even now, plenty of research has shown that lifetime cost including maintenance is lower for EVs.
EVs design affords less constraints and more interesting models. Removing a bulking engine means storage in the frunk. The best selling EV in China weighs only 1466 lbs (665 kg) and is less than 3 meters long. The first electric pickup truck, the Rivian R1T, has very high ground clearance for better offroading. The Rivian model even has an optional camp kitchen set built into their “gear tunnel” under the back seats. This is an early example of how EVs free from engine and exhaust requirements can be designed with novel features.
The fastest production cars in a straight line are already EVs. The 5 seater Tesla Model S Plaid is faster than the $3M Bugatti Chiron and every other million dollar hypercar.20 Its battery pack weighs about the same as the engine of the Chiron, and that’s not factoring in a full tank of gasoline.
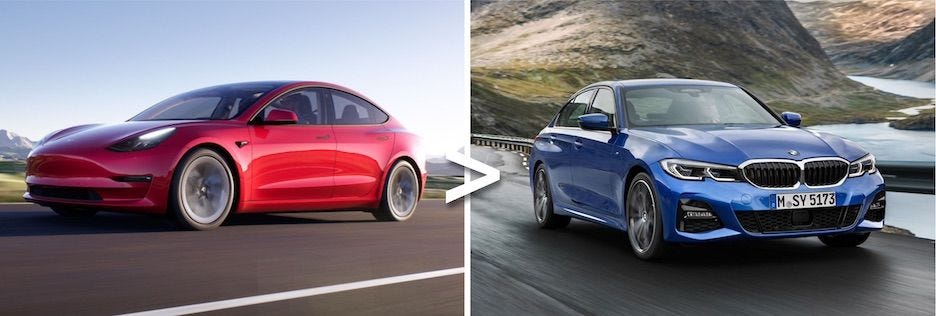
The Model 3 is the best-selling vehicle in its class in the world, despite being cheaper21 than competing Audi, BMW and Mercedes models.
We are at or close to tipping points for price, in which EVs outperform an increasing range of comparable gasoline vehicles.
As battery energy density keeps improving, EV makers can improve range or reduce battery size and cost. Range is getting closer to parity with ICE vehicles, rising on average globally from 211 km in 2015 to 338 km in 2020. Most of the best selling models sold outside of China have much more range — the 2021 Tesla Model 3 Long Range has 334 miles (537 kms), and the Mustang Mach-E RWD has 305 miles (491 kms).
Charging infrastructure is getting better all the time, though it tends to be better in areas with higher EV adoption like California, Norway or Germany. For people who can, charging at home is like plugging in any device and a much better experience than waiting at a gas station.
For apartment dwellers, charging is much harder for now. Public charging should become much easier as more charging infrastructure gets built or opened up. For example, Tesla’s global network of 25,000 charging locations is being opened up for use by cars by other EV makers.
Perhaps most importantly, there is an ever expanding selection of EVs, especially in China and Europe. There were 235 EV models in 2020, mostly in China and Europe, up from only 55 in 2015. In 2021-2022 in the US, selection is also ramping fast.
3.3 LIB and EV Producers Outpacing Tech Giants’ Growth
Internet companies have set the standard for the rapid speed of growth. Since the 90s, we’ve seen the meteoric rise of Amazon, Google, Facebook and many more since.
That made the following even more of a surprise when I ran the numbers.
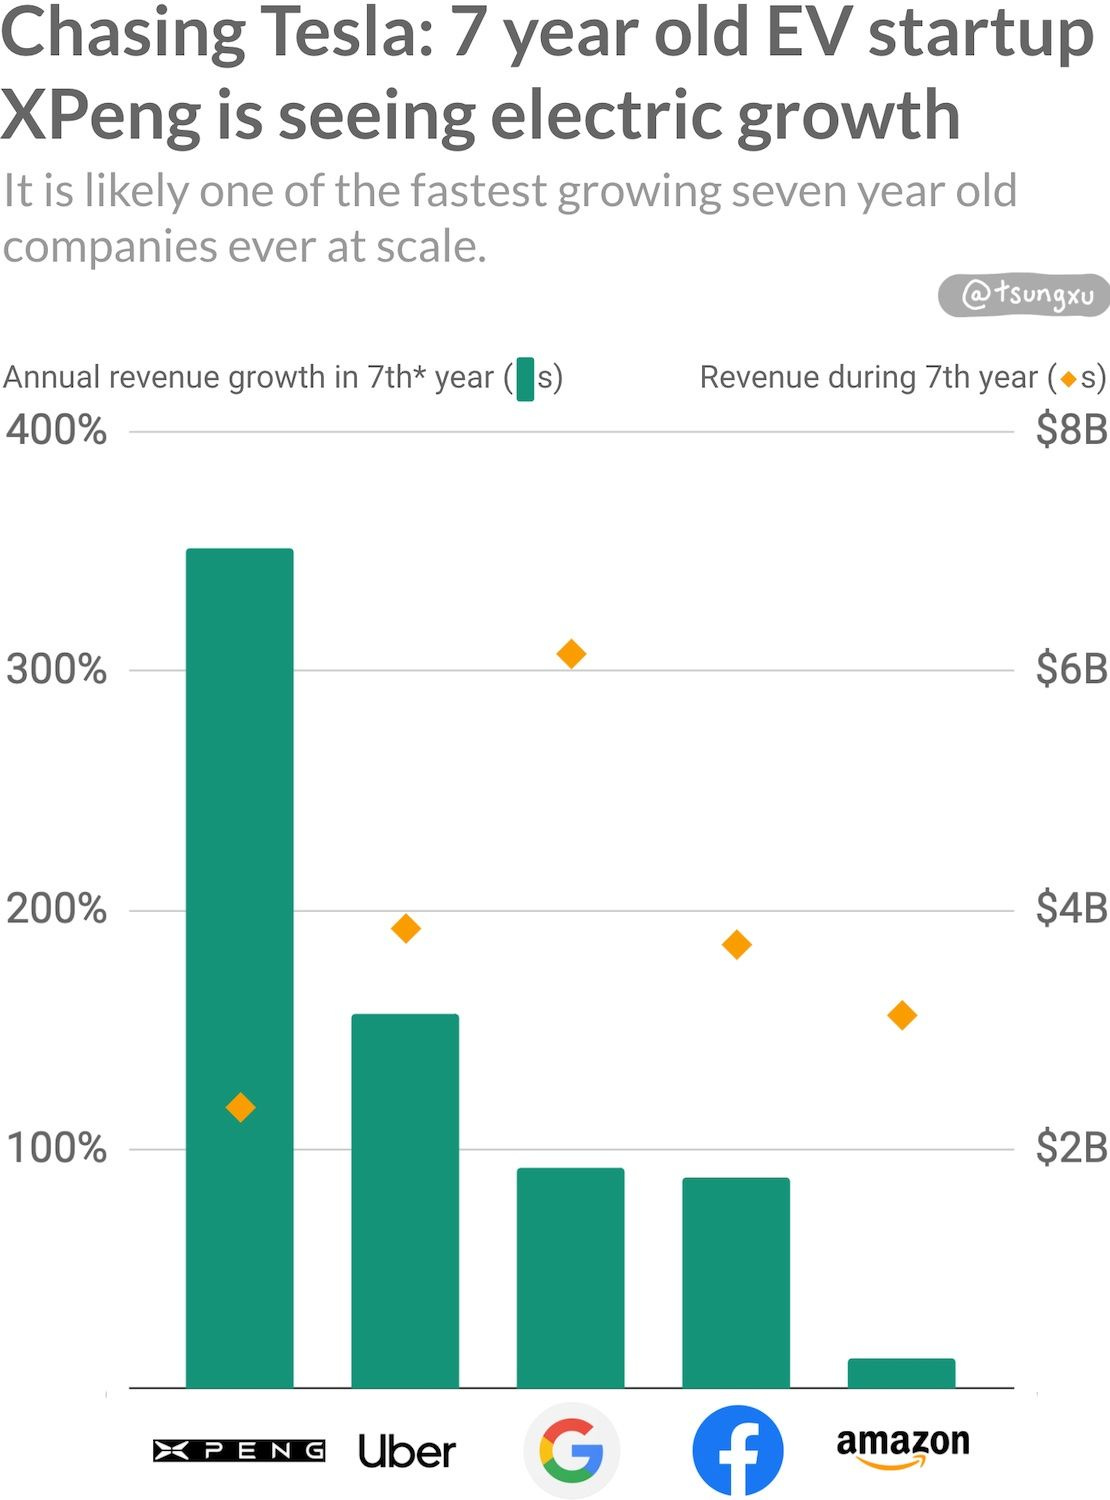
I realized that an LIB manufacturer and two EV companies have outgrown the internet giants at the same age. Growth rates are far beyond the tech companies, whilst revenues are comparable. Let’s look at these companies in turn — CATL, Tesla and XPeng.
CATL: Battery Powerhouse
So far, LIB manufacturer CATL is the largest winner from the boom in LIB production. It is ten years old, having been founded in 2011. In 2021, it was the top producer of LIBs globally with over 30% market share and growing, and has been for several years. Sales had grown to over $14B USD22 during the latest 12 months reported.
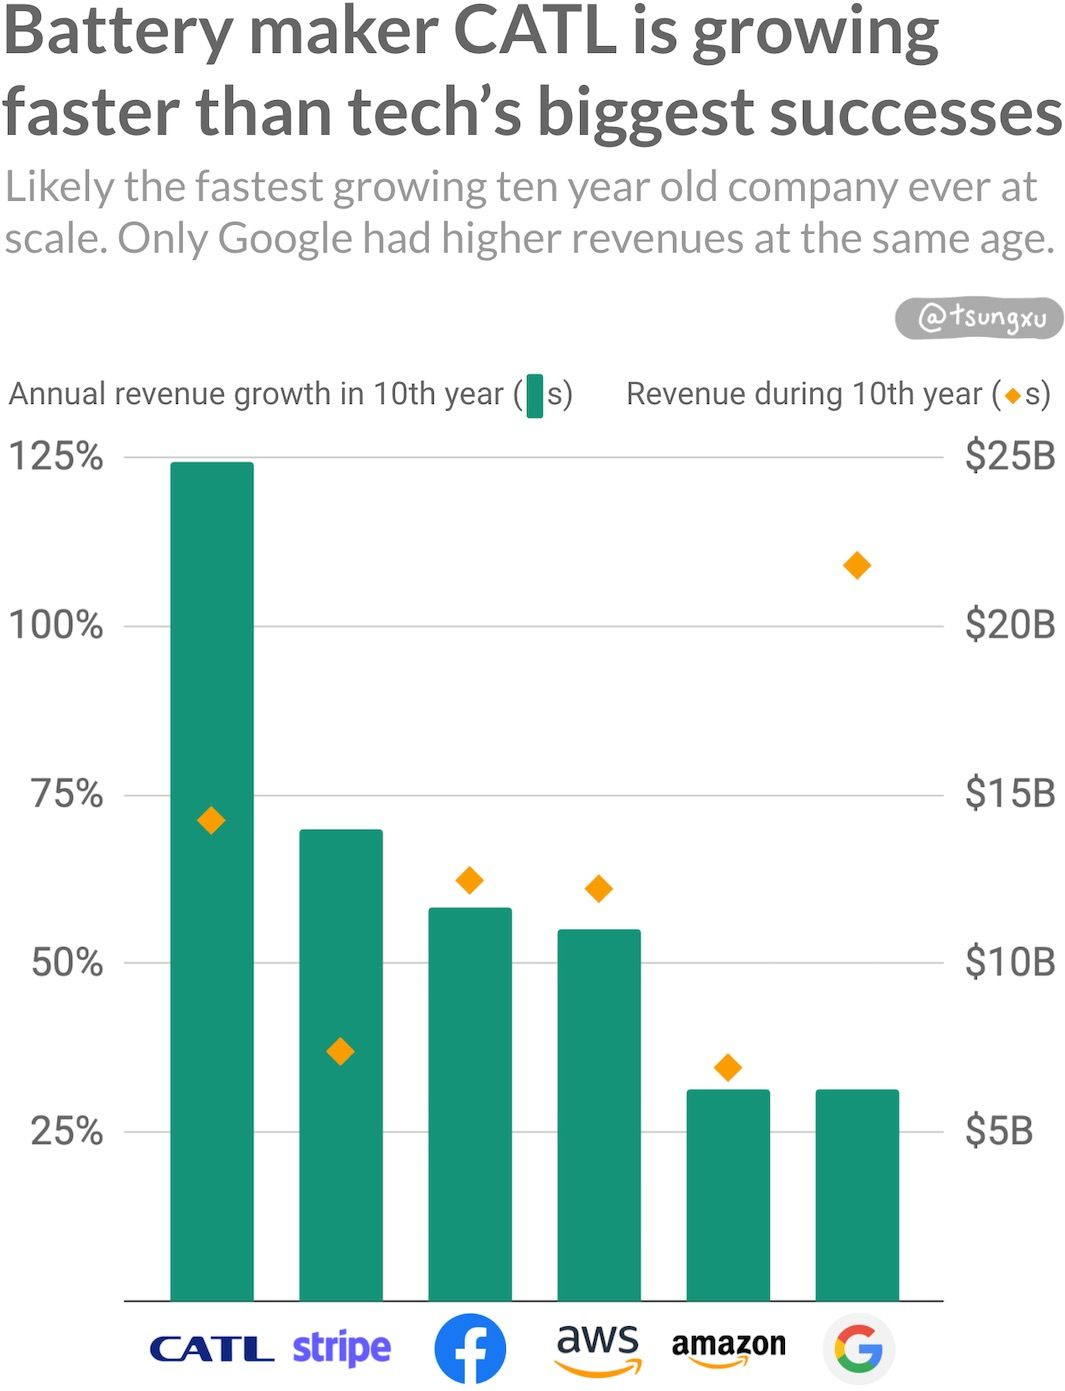
The pace of CATL’s growth is historic, as shown above. Its trailing 12 month revenue and net income skyrocketed more than 120% vs the previous 12 months. After ten years of operation, none of the tech giants were growing anywhere near as fast. Google was the only tech company that had more revenues after ten years but was growing at a relatively sluggish 31% year on year.
CATL is likely the fastest growing ten year old company ever, as measured by revenue growth. Oh, and it is already highly profitable.
Tesla: Pioneer and Leader
At eighteen years old, the pioneering EV company is also no slouch.
Tesla’s revenue growth also hold up very well vs tech giants, as shown below. In 2021, revenues were growing at 71% year-on-year, far faster than the tech titans at the same point in their histories, as you can see below. Facebook had much higher revenues in it's (latest) 17th year, but was not growing as fast.
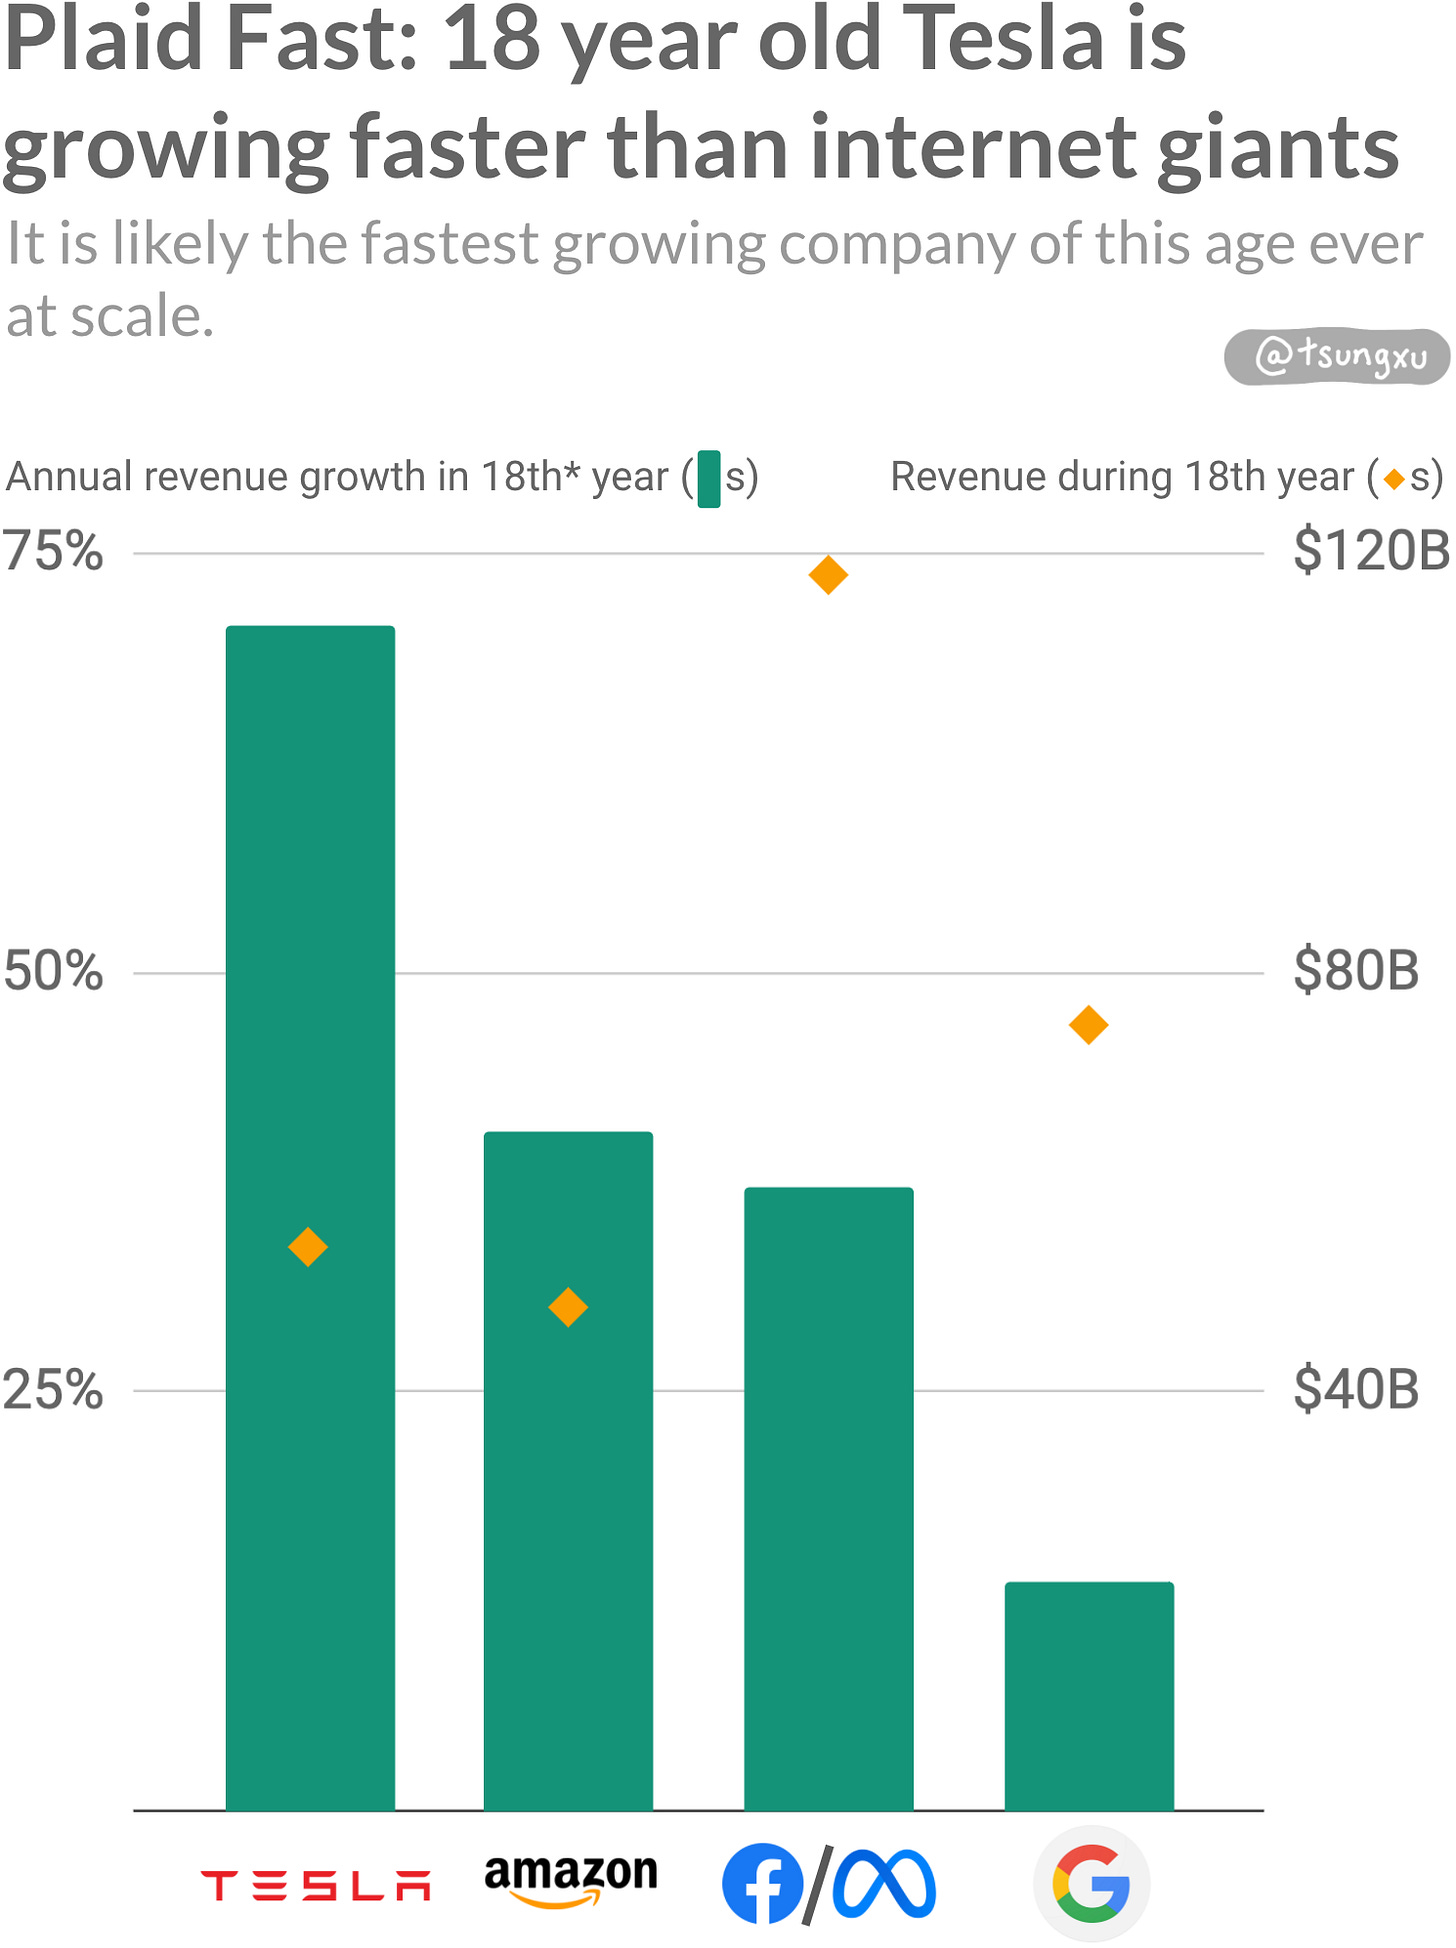
Let's put Tesla's astounding growth in perspective. Neither Google nor Amazon have grown this fast for at least 15 years, going back to their earlier days at much smaller scale. Facebook has not grown this fast since 2011, again when they were much smaller.
Tesla is growing this fast, when it is already this big.
XPeng: EV Challenger
Finally, there’s the next generation of EV startups with their sights set on Tesla.
The furthest along are the booming Chinese startups. Amongst those, none have arguably have gained more traction than seven year old XPeng. They’re the first EV startup since Tesla to sell more than 15,000 vehicles in a month, and almost 100,000 in a year.
XPeng’s traction is remarkable for a seven year old manufacturer of complex hardware, software and machinery, as shown below. In the twelve months ending September 2021, revenues soared over 350% from the previous twelve months, an industry standout during China’s record. This is more than double the growth rate of Uber during 2016. Google and Facebook in their seventh years both grew revenue at around 90% CAGR, whereas Amazon had a tough seventh year with low growth.
What About Profitability?
You might think that this looks great for Tesla, CATL and XPeng when considering top line revenue, but what about profitability?
Well, even here, their numbers are quite favorable. A good metric to compare profitability is EBITDA margin, which measures operating profit as a share of revenue.
Tesla's was 21.6% in 2021, up from 5.5% in 2017 during Model 3 "production hell". Auto OEMs averaged far less, at 6.8%. CATL's EBITDA margin was 22% in 2020, and fell a little to 19.5% in 2021 when it made massive investments in new capacity to meet surging LIB demand. XPeng, investing heavily to keep up with extreme growth, had a respectable -7.9% for the most recent quarter.
Amazon had less than 10% EBITDA margin until 2018, and is still "only" at around 13%. For Q4 2021, Uber's for rides and deliveries combined was 0.3%. With less capital expenses, pure software companies like Google and Facebook do have better EBIDTA margins vs CATL. Google's/Alphabet's has been between 25-40% whilst Facebook/Meta has usually been between 42-57%.
In short, Tesla, CATL and XPeng have profitability margins that looks more like tech companies with real-world operations like Amazon than like automakers.
Unpacking this narrative violation
Ten years ago, if I had said Tesla would be growing faster than tech companies in 2021, I would have been laughed at. People would have dismissed the possibility of a lithium-ion battery maker doing the same.
Yet, today we can no longer think of internet startups as the preeminent hyper-growth companies of the world.
The incredible growth of clean energy companies is most visible today in LIB and EV makers. Solar manufacturers for panels and inverters are also large and still fast growing companies in their own right.
It’s hard to see today’s use-cases that will become tomorrow’s leading industries, but many are very likely to be riding the clean energy transition.
With such incredible recent growth in LIBs and EVs, it’s not surprising US and European policymakers have big ambitions to rapidly scale up LIB manufacturing and mining.
Redwood Materials in the US and Northvolt in Europe have raised billions to build out battery gigafactories — founders from both companies are ex-Tesla executives. Diversifying global manufacturing could not only reduce reliance on a single country, it could also accelerate battery breakthroughs and progress down the learning curve.
The rapid growth of a manufacturing and mining-intensive industry has also raised questions about sustainability and reuse. Both battery module and EV manufacturers are increasingly recycling their batteries. Tesla works with third parties and recycles batteries themselves at their Nevada cell factory. BYD, one of the world's largest EV and LIB manufacturers, designs their cells to be easily removed for reuse. Redwood Materials works with EV makers to reuse depleted cells whilst Northvolt also plans to recycle 95% of the batteries they will produce.
3.4 Storage For Grids Is Booming
The energy storage market is booming.
Stationary battery storage has historically mostly been deployed standalone. These earn revenue by helping the grid in a growing number of ways. LIBs have become cheaper, battery storage has excelled in high-renewable grids like California, Texas and Australia. They can now economically offer 4 or more hours of electron storage (and growing).
Global storage deployments grew at about 58% annually from 2013-2019, and has accelerated since then. The US market has been surging even faster, more than doubling gigawatt-hour capacity every year since 2013 on average. This is shown in the chart below. In 2021, it will nearly quadruple deployments made in 2020, which in turn were triple what 2019's deployments were.
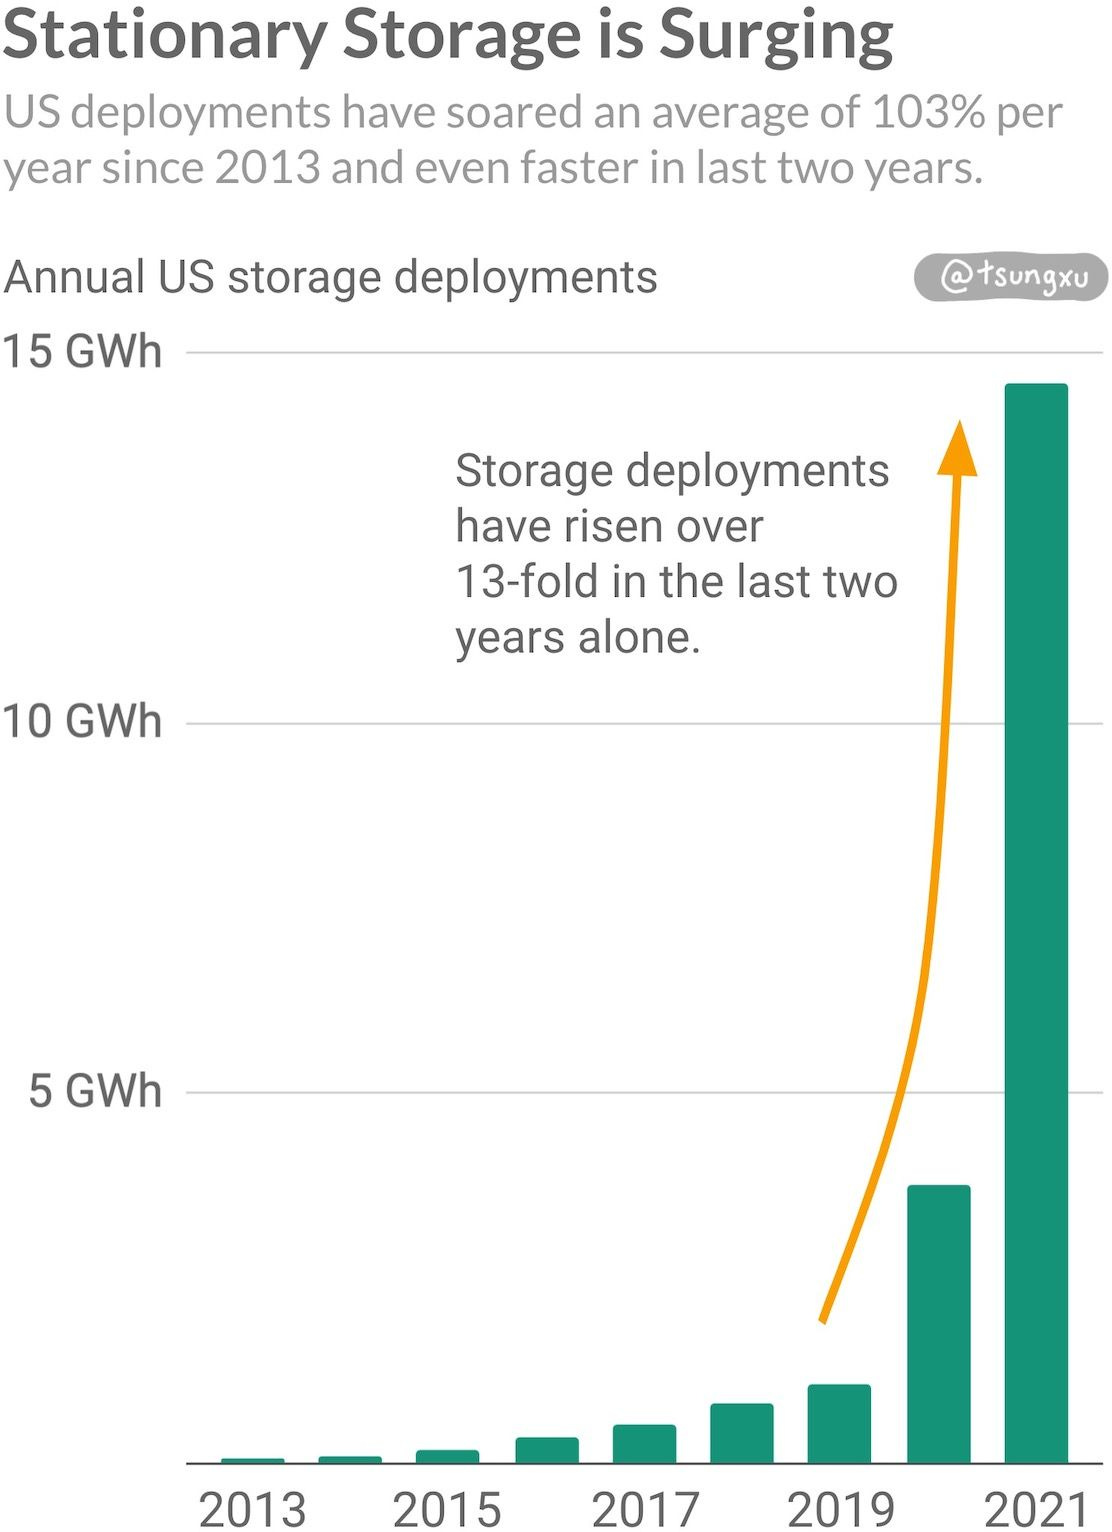
Storage is even more valuable when paired with solar
Part of that recent astronomical growth is the mutually beneficial nature of pairing utility-scale storage with solar. This allows batteries to freely charge during sunny enough days and discharge in the evenings when electricity demand is usually high. Colocating them adds a larger load-balancing benefit to the grid than having separate sites for standalone projects. Another benefit is that a colocated storage and solar install shaves project costs by around 6%.
With paired storage, grid operators and market participants can continue deploying more solar onto grids everywhere with confidence.
This appeal has driven over a third of interconnection queued US solar projects to include onsite storage, as shown below. Even as solar deployments keep rising, storage is catching up fast. This is shaping up to be a flywheel effect for solar and storage to mutually drive more growth in the decade ahead.
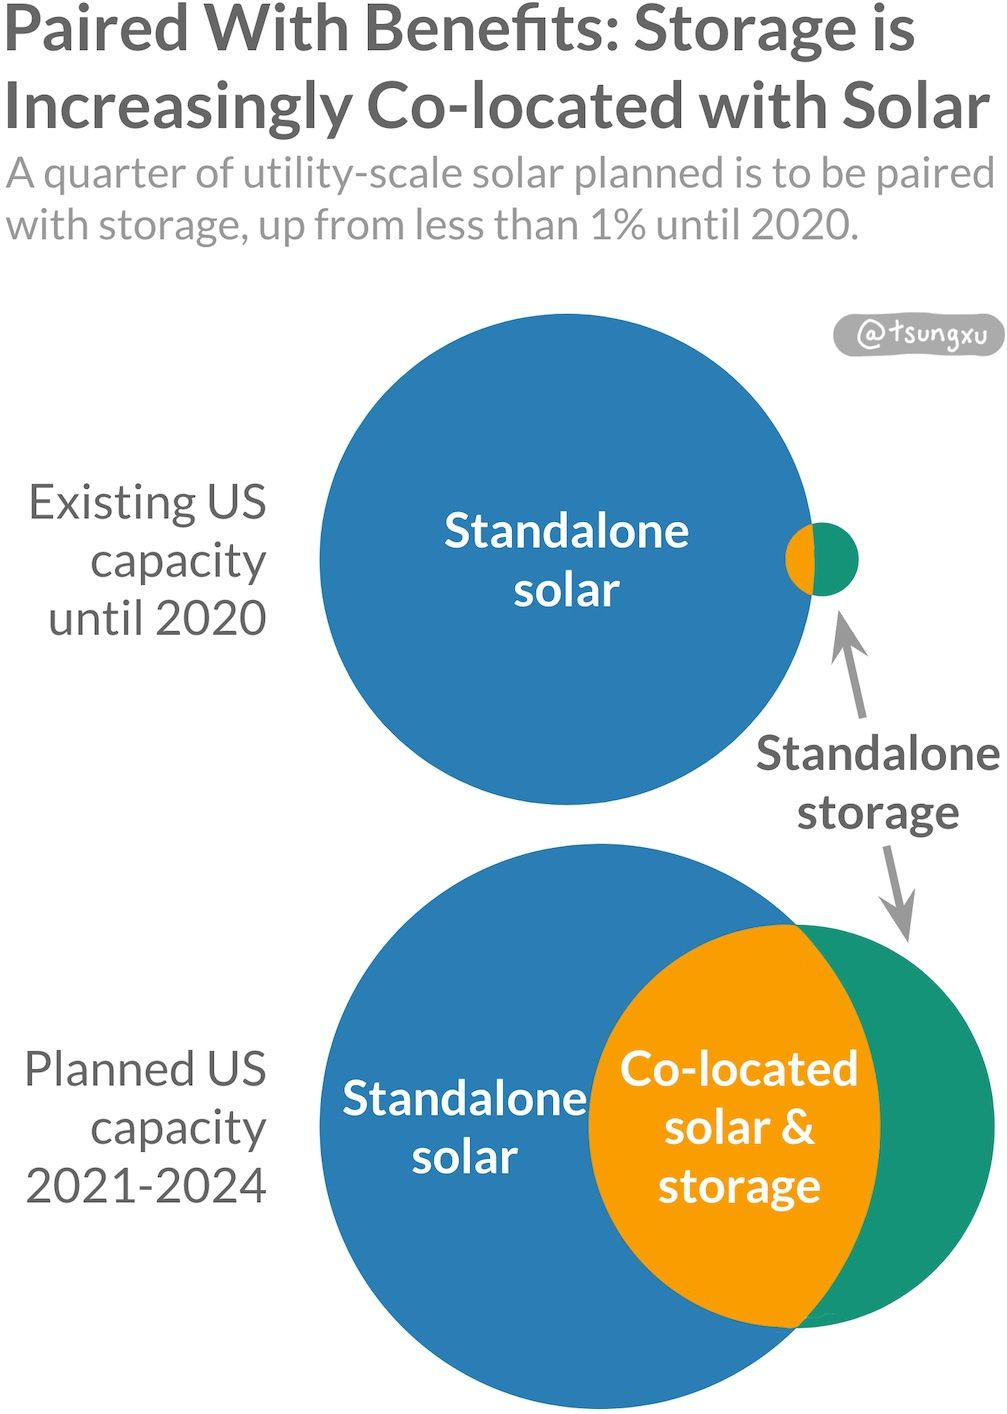
In mid 2021, with so much demand for stationary storage, Tesla had an 18 month backlog for Megapack, their utility-scale storage product. Massive battery manufacturing ramp up is coming online to serve the booming EV and storage markets, but even manufacturers did not anticipate this much demand. New battery gigafactories are announced seemingly every week in China , Europe and the US.
It's likely we will increasingly see more integrated approaches to solar plus storage. For example, Yotta Energy has developed lithium iron phosphate battery modules that slot under solar panels on commercial rooftops. The battery acts as a ballast for each panel, increases installation speed and lowers the cost.

We will not have to rely solely on utility-scale batteries to store renewable electrons. Long duration storage can help the grid store days worth of electrons. They promise to be more economically viable than LIBs and add redundancy. Batteries as distributed energy resources can backup large buildings or an RV. Recent research shows that allowing electrons to be stored anywhere can actually make grid investments cheaper and enable more utility-scale renewables. Second life EV batteries are already and will increasingly be repurposed as useful and profitable storage for grid electricity.
3.5 Home Energy Storage: Three Approaches
There is a Cambrian explosion happening for home storage backup solutions.
Home battery storage (called wallbox units) like Tesla’s Powerwall are often paired with rooftop solar for resilience during power outages, such as during the Texas winter storms.
In addition, alternatives like EV batteries and more portable batteries offer other ways to store and use electrons in a pinch.
A mid-sized EV’s battery pack has the energy capacity of about five Powerwalls. Given this, using EV batteries for home storage is very promising for home energy backup. There are problems to solve though. Some drivers and EV makers are concerned about battery warranties if their batteries are also used for powering homes.
This has not stopped EV makers like Rivian from offering power for optional onboard induction cooktops, and Ford’s F150 EV enabling 90 kWh of vehicle to home charging. The Ford’s battery would power everything in the average US home for at least 3 days, and has the capacity of almost 7 Powerwalls.
VW, Hyundai and Fisker are also planning to offer vehicle-to-home (or even to building/grid) charging while Nissan has used Leaf batteries to power lights in buildings during blackouts since 2011.
If you had 3 million electric vehicles interconnected to the grid in the state of California and each of them dispatched half their battery, you’d eliminate all fossil fuel use in the state between 6:00 p.m. and 11:00 p.m. to midnight.
— Ed Fenster, Sunrun co-founder and chairman
In a state with almost 15 million cars, having just one in five dispatching their batteries replaces the need for evening peak fossil fuel generation.
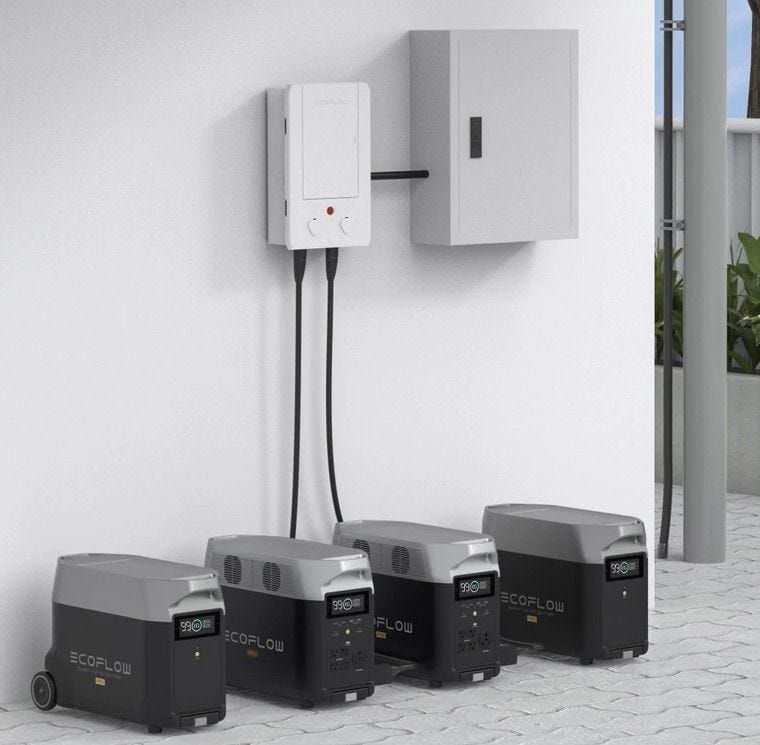
People living in most apartments likely can not set up a Powerwall or an EV battery to backup their homes.
Instead, many are starting to use portable batteries. These are modular products offering multiple AC, and DC outlets that are smaller and more portable than heavy wall mounted units. The newer models like the Ecoflow Delta Pro use lithium iron phosphate battery chemistry, allowing for thousands of charging cycles. These in particular can be stacked with more batteries to offer up to 25kWh of capacity (almost two Powerwalls) and even connect to an electrical panel to power anything in a home.
In the last year or so, interest in these power stations has exploded, with Ecoflow Kickstarting over $12M for their latest Delta Pro and Delta Max products, the most ever for a Kickstarter tech product. They also raised a $100M series B recently. A competitor, Bluetti has also raised over $10M across two home battery crowdfunding campaigns.
There’s likely a large role for each type of storage described above in the clean energy transition. More energy backup in homes and EVs improves not only resilience, but also complement and adds redundancy to utility-scale storage.
3.6 LIBs Continue Getting Cheaper and Better
Until LIBs, we had never been able to store clean electrons anywhere or at any scale.
It’s interesting how, unlike solar, wind or any other energy technology, the humble lithium-ion battery has never really been hyped. Batteries have just slowly found its way into billions of electronic devices.
Very likely, battery tech will keep moving down the learning curve and the speed of deployment will not slow down. As we’ve seen, the EV and storage markets alone should be plenty to continue the rapid scale up of battery use, whilst lowering prices at the same time.
There are many companies working on numerous ways to improve batteries — higher energy density, lower cost, increasing cycle count and more. These changes are happening at the cell level (like developing new cathodes/anodes with better characteristics) and pack level (maximize actual cell space used, integrating batteries into product structures, etc).
Battery energy density can keep improving for a long time. In batteries using lithium-sulfur chemistries for example, the gravimetric energy density achievable is up to triple that of commercialized LIB chemistries.
The battery supply chain continues to improve. New lithium extraction and refining methods like from Lilac and EnergyX save water, land and recover more of the mineral. EnergyX's approach expects to lower the refining time from 18 months to a few days. In addition, onshoring lithium mining reduces supply chain risks. Cobalt, an essential mineral in higher-performance batteries, has supply risks and ethical mining concerns. Companies are already reliant on cobalt by either lowering its concentration in cathodes or using cobalt-free alternatives.
Increasingly, EV makers like Tesla, Volkswagen and Fisker are using cobalt-free lithium iron phosphate (LFP) cathodes for their base models. LFP’s share of the lithium ion market is surging, up from 15% in 2020 to 24% in the first half of 2021. The top selling EVs globally like Model Y and 3, China’s best-selling Hongguang MINI EV all use this chemistry. LFP batteries are about 20% cheaper to produce and less fire-prone vs nickel-based ones. They do, however, trade off slightly lower energy density.23
Batteries that replace lithium altogether are also in development. For example, sodium-ion batteries for EVs and storage that promise even lower cost and operation in more extreme weather conditions. They trade off lower energy density for now.
There’s a lot of work ahead for the development of high performance batteries, but it’s very likely batteries will keep getting cheaper, more energy dense and last more cycles. Just like improvements unlocked batteries able to fly drones, power cars and store electrons at scale, future improvements will power new uses and markets.
3.7 Some Emerging Use-cases
There are LIBs already used in vehicles of all sizes, though it is early days for most markets. As batteries get cheaper and better, watch for accelerating EV adoption in the following vehicle types. Which of course, is great news for the clean energy transition.
Let’s start with electric two wheelers, which include motorbikes, scooters and mopeds. In 2020, already over one third of all global two wheeler sales are electrified, driven by China. Notice in the chart below that India is lagging with their share of two wheeler sales. Ola Electric, spun out of the largest ride-sharing company in India, is changing that. They recently sold ~$150M USD worth of their S1 scooter in only two days. This was the highest sales ever in India for a vehicle (or any product online) in such a short time.
In heavier vehicle categories, buses and vans are already starting the transition to EVs. For example, Shenzhen in China made their whole bus fleet electric by 2018, thanks to government subsidies to pull forward the tech. With trucks, industry perceptions have changed from just a few years ago as batteries keep getting better. Research has shown they can already drive short-haul routes, which make up half of those in the US.
Electric trucks will still take a few years to reach cost competitiveness, but large European manufacturers are all in, having pledged in 2020 to sell only electric and hydrogen trucks by 2040. It’s likely they’ll move faster than that. Even electric tractor startups (some with founders who, of course, were ex-Tesla) are growing fast and dealing with long order backlogs.

Electric vertical takeoff and landing (eVTOL) aircraft are a harder problem than terrestrial transport. Battery power density and electric motors are not yet good enough for flight, but this is changing.
The first eVTOL flying short commercial routes could happen as early as next year, connecting Boston and Cape Cod. This specific route is currently unprofitable and subsidized for jet aircraft, as are other short routes in areas around the world because of high fuel and operational costs. EVTOLs offer cheaper flights with faster door-to-door times.
These use cases can be niches that small eVTOL aircraft tap into before expanding into other markets. Airlines and logistics companies are interested, with American Airlines, Virgin, United Airlines, UPS and others all placing preorders for thousands of EVAs from various startups that are aiming to deliver aircraft in the mid 2020s.

4 As Energy Becomes Even Cheaper…
Cheap electricity matters a lot, especially for larger (literal) power users. Aluminum smelters, data centers, crypto miners and more are all heavily electricity-intensive industries which seek out low cost sources of power today.
Solar and wind are now the cheapest electricity sources in history and solar has the fastest falling costs of any energy source in history. In the last one hundred years, electricity prices for power-hungry industries have never fallen as fast as solar PV’s costs plummeting in the last ten years. Not even close.
We will look at how electrical prices have actually been flat since the mid 20th century. Falling electricity prices are not something energy entrepreneurs or policy makers have seen nor expected within our lifetimes.
This section then revisits how electricity prices from solar and wind will continue to get cheaper. It will cover how this will mostly benefit energy-intensive industries in sun and wind rich, policy friendly regions like Texas. We will see how companies are starting to buy electricity directly from producers. Finally, this section ends with examples of how cheap, clean energy is accelerating electrification in existing industries.
4.1 Electricity Prices Had Been Stagnant, Until Solar and Wind
In the US, the real price of electricity for industrial users has been fairly flat since the 1950s.
In other words, industrial electricity users have not seen lower costs since WW2 and the Great Depression when adjusted for inflation. Adjusting for price levels allows us to compare prices across time as the cost of doing business rises with prices.
As seen in the chart below, there was a spike during the 70s triggered by the oil crises but prices reverted starting in the early 80s. Since the late 90s, prices have been pretty stagnant in real terms.
This makes sense from the lens of energy transitions. As discussed, solar and wind are the first manufactured electricity sources in history with substantial learning rates. No other source of electricity has pushed costs down as quickly as solar when scaling. Power-hungry companies around today have never existed in a world where energy costs have fallen, or could have fallen rapidly.
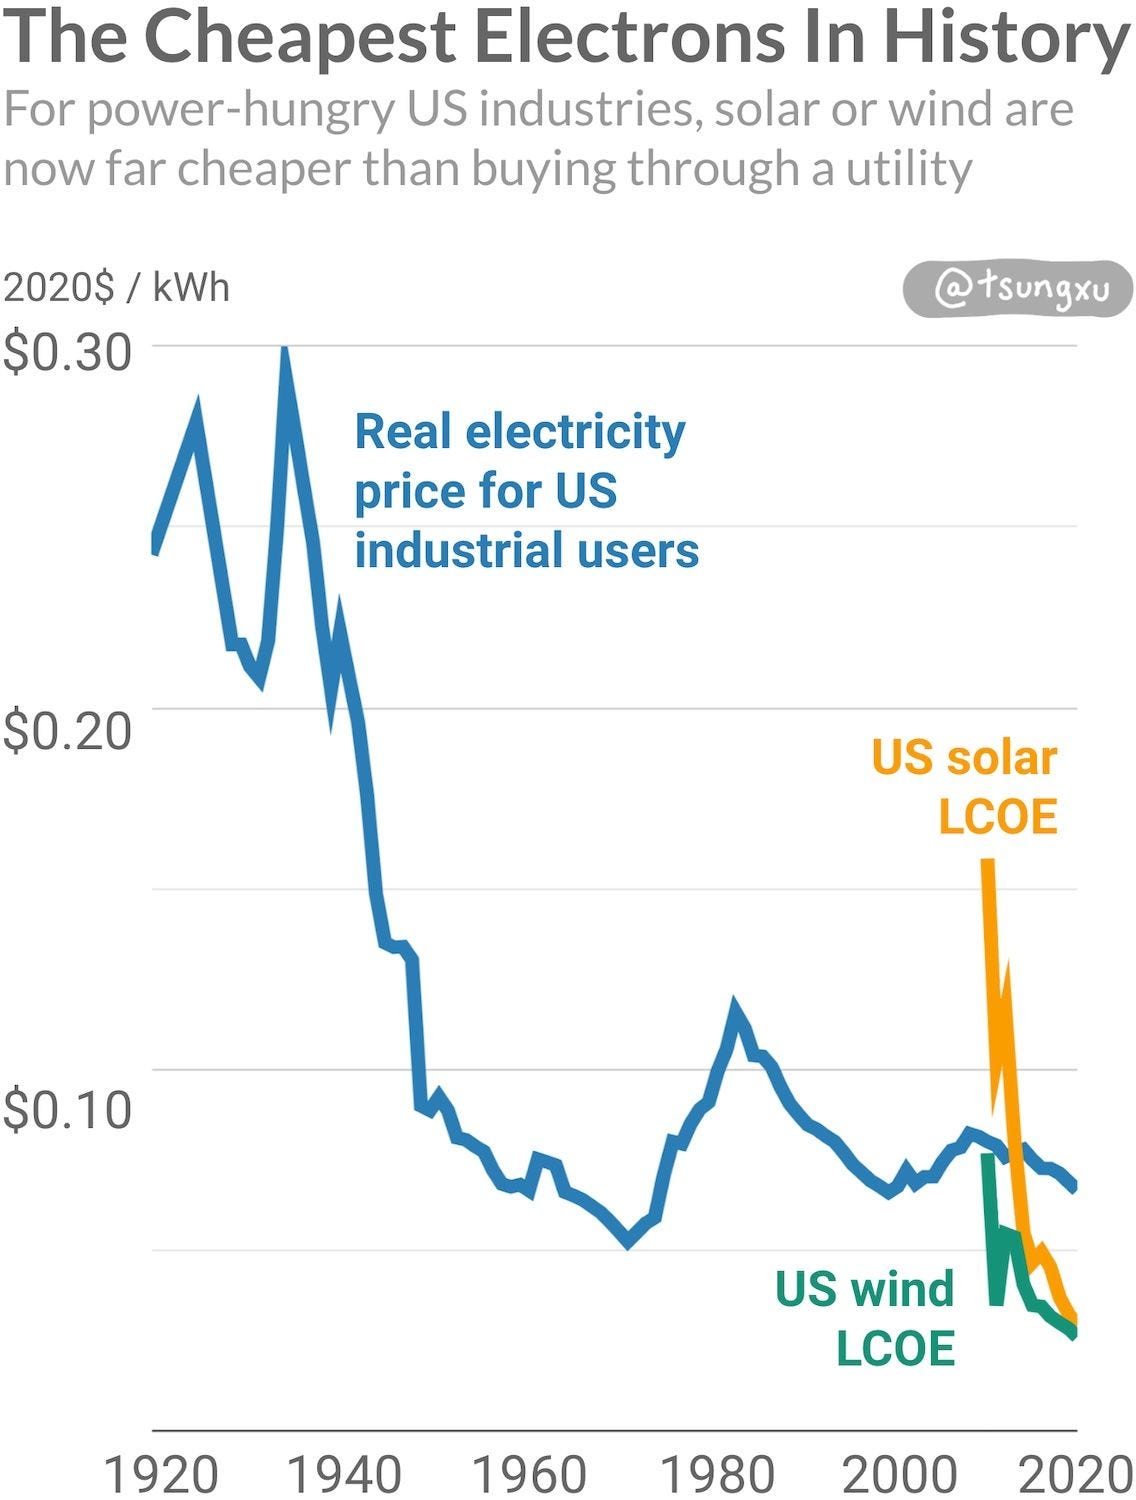
While electricity prices are more or less flat, the cost of solar-generated electrons has plummeted.
As we will discuss, there’s an increasing number of companies taking advantage of and betting on this cheap electricity. When energy costs are the majority of their overall cost structure, this makes economic sense.
You might notice that the LCOE of wind has been much lower than the cost of industrial electricity for over ten years. Why have industries not taken advantage of these low prices earlier?
One reason is that until the last few years, very few companies actually bought power (physically or virtually) direct from solar or wind developers. These contracts are a recent innovation that clean energy developers are becoming increasingly comfortable with only recently.
Another is geographical mismatch. Solar and wind sites that offer cheap electrons tend not to be near population centers. The costs are getting cheap enough that some industries, crypto mining in particular, have been setting up shop next to solar and wind plants to reap the benefits.
Finally, the intermittency of solar and wind cause challenges for existing industries. Mature industries like aluminum have needed "firm" sources of electricity to maximize the capacity of capital-intensive (i.e. expensive) plants. Alcoa and other aluminum smelters had already sought low-cost electricity, for example, from hydropower in Iceland.
As we’ll see, there are industries starting to build for intermittency as a feature. Green hydrogen production, CO2 utilization and crypto mining are all looking to leverage low cost electricity when the sun shines or wind blows. Battery storage will also increasingly enable less intermittent cheap clean electricity as well.
4.2 Lowest Prices In Sunbathed and Windy Regions
According to Lazard as we showed earlier, LCOEs for solar and wind in the US in 2021 are $0.028 and $0.026 per kilowatt-hour respectively.
These LCOEs are already very low but are only aggregated values. Many solar and wind projects offer cheaper electricity than these numbers.
For example, in Saudi Arabia in 2021, a 600 MW solar project was priced at $0.0104/kWh. This price for sun-powered electrons was unthinkable even in 2017, and is the lowest cost electricity in history. But it’s not just Saudi Arabia. Many countries from Mexico to Chile and Ethiopia are now seeing solar LCOE come in below $0.02/kWh.
This is also happening in the US. El Paso electric utility, which serves West Texas and part of New Mexico, agreed to electricity supply from a 100MW solar plant costing just $0.015/kWh, and a solar and 100MW / 50MWh storage plant costing $0.030/kWh. The local coal fired power plant costs much more, $0.045/kWh, just to run.
Texas has historically been very fortunate with its vast wealth of oil and gas resources. It also has always had tremendous solar and wind resources in its west, treasured assets for the clean energy transition. The Lone Star State had the most wind capacity installed of any US state by far, with China and Germany being the only countries that produced more electrons from wind power in 2020. Texas should overtake California by 2023 to have the most solar capacity installed of any US state.
As renewables ramp up faster in parts of the US, Europe and Australia, some areas are increasingly seeing negative pricing for wholesale electricity. That is, solar and wind plants and other energy producers have to pay utilities or companies for electricity they produce. High-wind West/North Texas and the Central Great Plains, some European countries, high-solar South Australia and California to a lesser extent all see this happen. As shown on the map below, some localized areas in wind-rich Texas, Kansas and Oklahoma see negative electricity pricing over 20% of the time.

One point about intermittency is that battery storage does not add much to solar costs, and as we discussed earlier, storage prices will come down even faster. NREL costing has found four hour battery storage with current tax credits adds only around $0.028/kWh to utility-scale US solar prices in 2020. That’s roughly doubling the average cost, which still makes it cheaper than industrial electricity prices today. LIBs for utility scale storage are currently more expensive than for EVs, but expect the costs to come down more as the storage market keeps rapidly growing.
4.3 Buying Ultra-cheap Electricity, Direct
Some companies are already taking advantage of the cheapest energy around. To do this right now, they usually need to buy electrons directly from renewable project developers.
The US is leading the world in corporates buying clean power directly. This trend in corporate buying of so-called power purchasing agreements (PPAs) has been led by tech giants like Google, Amazon and other tech giants with aggressive net-zero emissions targets. In 2020, US companies signed 11.9 GW worth of corporate PPAs for clean energy, which represents about one third of all US solar and wind capacity for the year.
The catch is the majority of these purchases are “virtual PPAs” meaning that the companies do not use the electricity directly, but act more like a direct offset for their electricity used in a location that could be hundreds of miles away from the solar/wind plant. These contracts can help companies to reduce “scope 2” CO2 emissions from electricity use, hedge against rising utility energy costs, or receive renewable energy credits which can be sold.
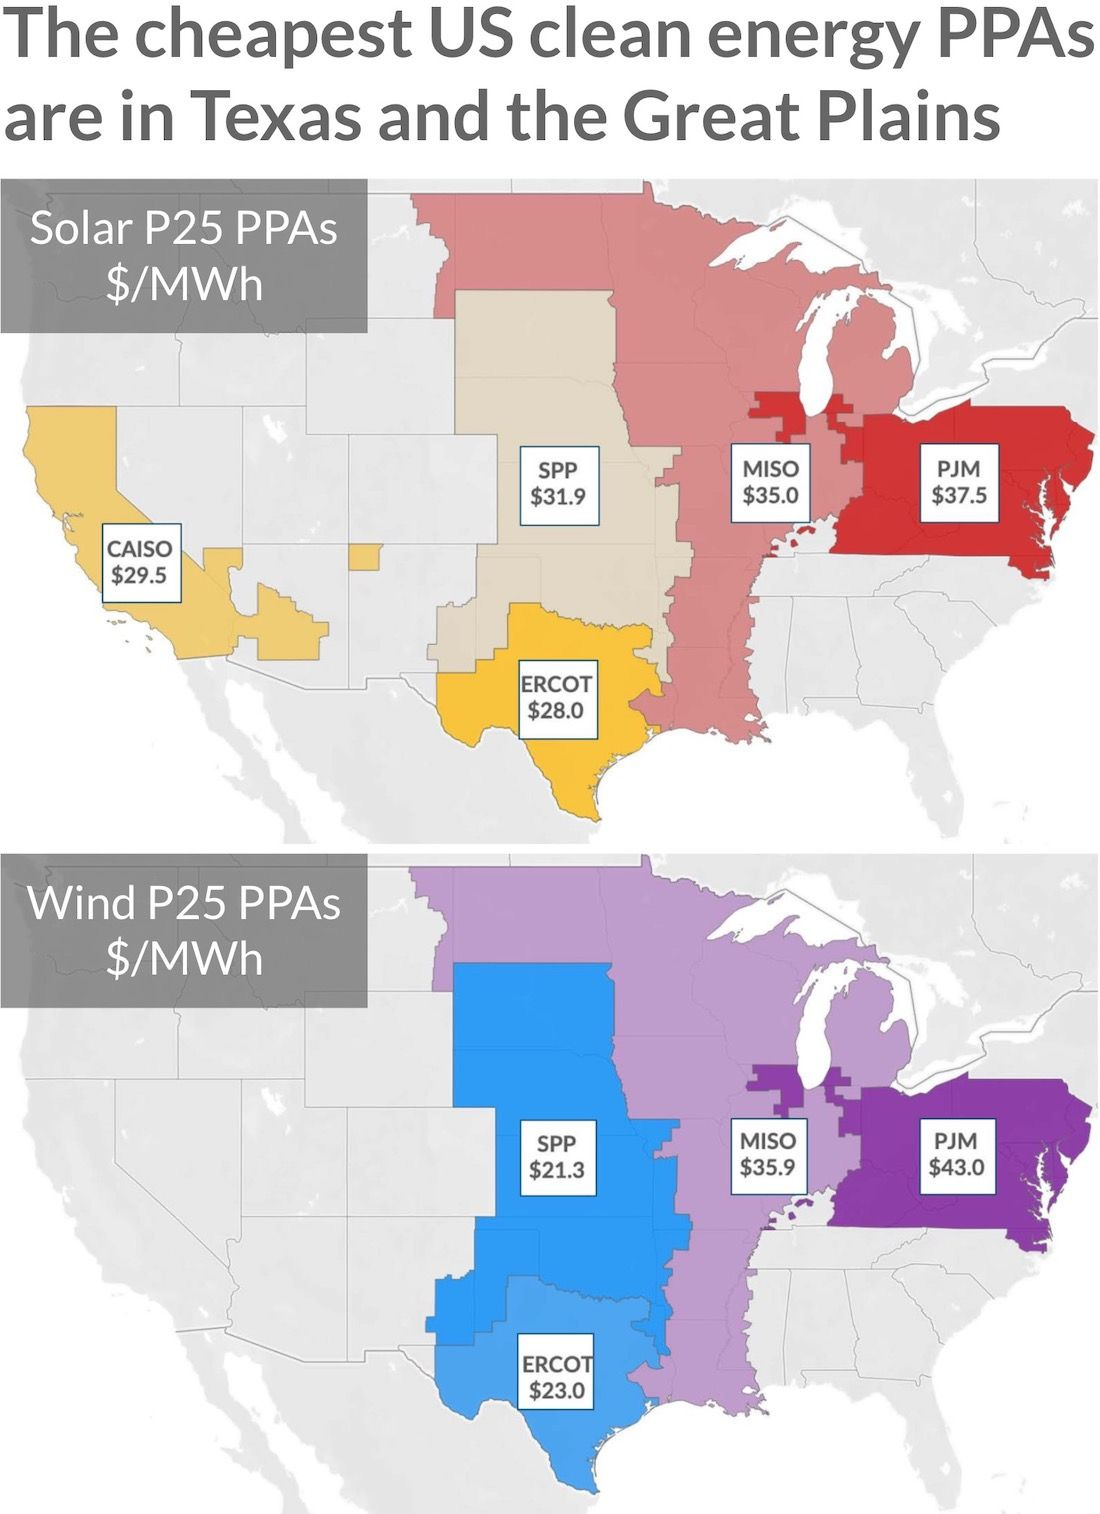
The chart above shows that virtual PPA prices are quite low for companies, especially in ERCOT (which serves most of Texas) for solar and wind and SPP for wind.24 These virtual PPAs have to be connected to the respective grids, whereas colocated industrial electricity users can bypass these slow and costly grid connections.
Because of the success of corporate PPAs, renewable project developers are now familiar with selling electricity directly to companies. Increasingly, motivated energy-hungry businesses are locating operations right next to cheap solar and wind power. This is economically viable for many companies, especially in manufacturing and crypto mining in which electricity is a significant share (or even majority) of their operating costs. It also saves developers costs and delays in grid connections.
There is the problem of intermittency when co-locating (known as "behind the meter") with a solar or wind plant. If the electricity-hungry process is capable of operating almost all the time, it faces higher capital costs to idle at night or on a still day. Storage is an option, but viability depends on the (additional) cost of the electrons that the storage can provide. Right now, there is definitely a tradeoff.
Driven to reduce costs, crypto mining is an early example
For example, many crypto miners have set up in West Texas for cheap solar and wind power and in New York and elsewhere for cheap hydro and nuclear. They often co-locate with the cheapest clean electricity sources they can find. Electricity is the vast majority of their operational costs, and crypto mining is only profitable below a certain electricity price which depends on the mining equipment used.
Crypto mining can be turned on or off in seconds. This allows miners (and grids) the flexibility to turn off when electricity prices spike. During the Texas winter storms, some crypto miners turned off for 2 days because surging electricity prices incentivized shutdown.
There is a significant divide in the climate tech industry about whether crypto mining should be able to use renewable electrons. Mining can act as flexible electricity demand but often does not. Still, colocating mining (or any other power-hungry operation) next to solar or wind farms means bypassing the long interconnection queues and transmission line limits we discussed earlier.
Other crypto miners are capturing the heat used from mining, and selling it to utilities. As perhaps the first project of its kind, MintGreen almost completely pays for its electricity cost by capturing and selling district heat to 100 buildings in North Vancouver. This enables utilities to avoid GHG emissions from natural gas furnaces and could signal the early days of a new way for reusing distributed heat sources.
More so than crypto mining helping the grid, there will be more and more industries with high-electricity operating costs looking to use the cheapest, cleanest energy available. Colocating these high power users with the clean power plants helps create more demand for clean energy, without making interconnection queues worse or requiring more transmission line upgrades.
4.4 Falling Electricity Costs Will Transform Industries
Solar and wind are far from done in getting cheaper. They and LIBs will continue scaling quickly, and progressing along their learning curves. In the process, they will accelerate the rate of electrification that we covered earlier.
Today, solar and wind only generate about 10% of electricity globally. Only about 40% of all energy is electrified. There’s clearly far more upside as we electrify fuel-burning industries from EVs to space heating and much more.
Space heating and cooling for homes and buildings will increasingly be electrified, with annual shipments of US heat pumps doubling to 3M from 2010-2019. Startups like Gradient are trying to be the Nest of home heating, and are attracting funding.
Manufacturing steel and concrete account for around 20% of CO2 emissions, but there are promising pathways including electrochemical processes for steel that become cheaper as electricity does. Low carbon concrete is already pouring into construction projects while Sublime (electrochemical) and Brimstone (carbon negative) are producing cement in new ways.
Instead of shutting down, a Colorado steel mill will continue to run by sourcing very cheap electrons from a new 300MW solar plant built nearby. They will get access to solar that’s cheaper than $0.03/kWh, powering 90% of their electricity needs.
Rondo is a startup generating industrial heat (previously derived from fossil fuels), using renewable electrons stored in insulated rocks. Antora is using a thermal photovoltaic process to do something similar. Green hydrogen (made from clean electrons) could be used here too. Even the petrochemicals industry has emerging carbon-negative processes like Solugen’s chemienzymatic approach.
Nitricity creates nitrogen fertilizer from air, solar electricity and water, mimicking how lightning storms break down nitrogen in the air for fertilizer. They use solar PV to generate “containerized lightning” which they combine with air alone to create nitrogen in solution. This is then fed into farms’ irrigation systems.
These are all existing industries that will continue to be electrified. Let’s now hone in on two new use cases that could be accelerated by the clean energy transition.
Electrochemical capture and use of CO2 from the air and
The production of graphene and 2D materials.

5 Opportunity: Removing & Using CO2
Since the industrial revolution began, humanity has emitted around 2.4 trillion tons (teratons) of additional CO2 into the air and oceans.
As shown in this chart, this mass of atmospheric CO2 is likely even more than all the post-1900 human-made stuff and current living biomass combined!
Whilst this much excess carbon in the air and oceans can sound like climate doom, it is actually a massive opportunity. An increasingly vibrant community of startups, investors, policy makers, researchers and more are working on solving this problem.
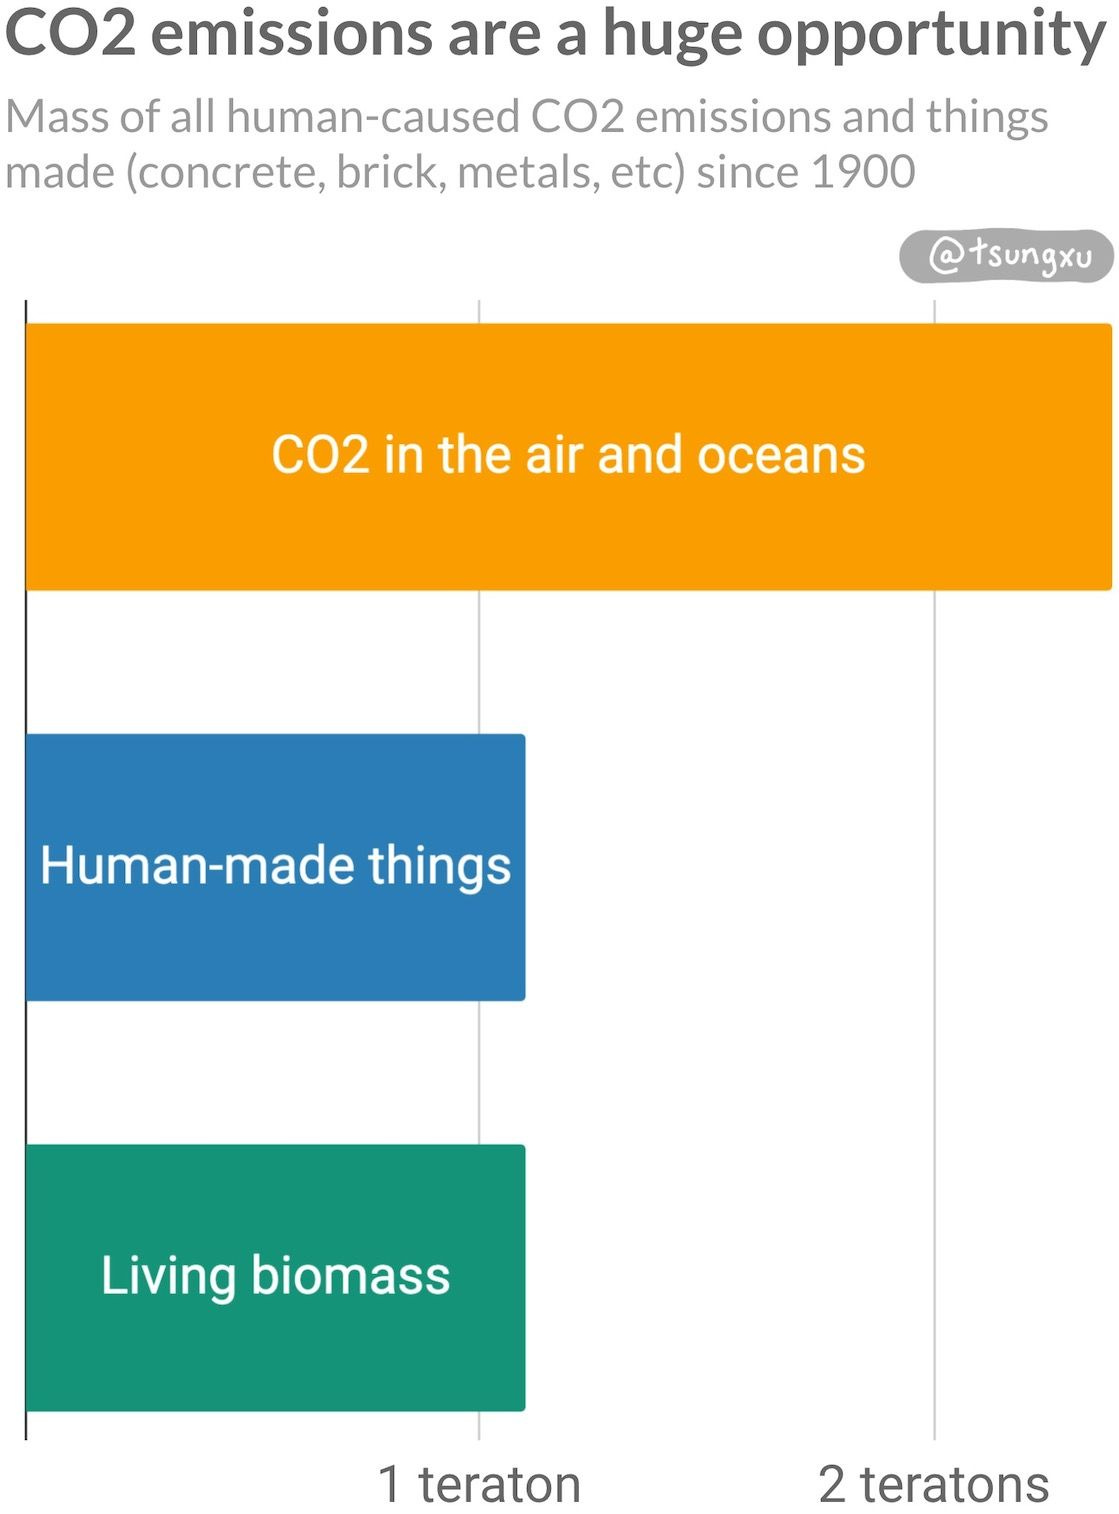
That’s an unfathomable mass, so let’s look at yearly cement production and fossil fuel emissions. Cement is the most used human raw material after water, and globally about 4.2 gigatons are produced every year. That pales compared to CO2 emissions, which are over 35 gigatons per year. Every year we produce close to an order of magnitude more CO2 than cement.
CO2 is already being used in beer and carbonated beverages, prolonging shelf life of foods as well as medical and industrial uses. These 2.4 teratons of human-emitted CO2 in the atmosphere could be used to enable a clean carbon economy or be permanently sequestered underground, both of which we will come back to.
5.1 Negative Emissions Derisk Climate Scenarios
There’s still a lot of work ahead to keep rising CO2 levels from having large societal costs.
Warming temperatures, more flooding, drought and rising sea levels can not be avoided because of already emitted CO2. But the worst impacts can only be avoided with carbon removal, as made clear by the IPCC in their 2021 and 2018 reports.
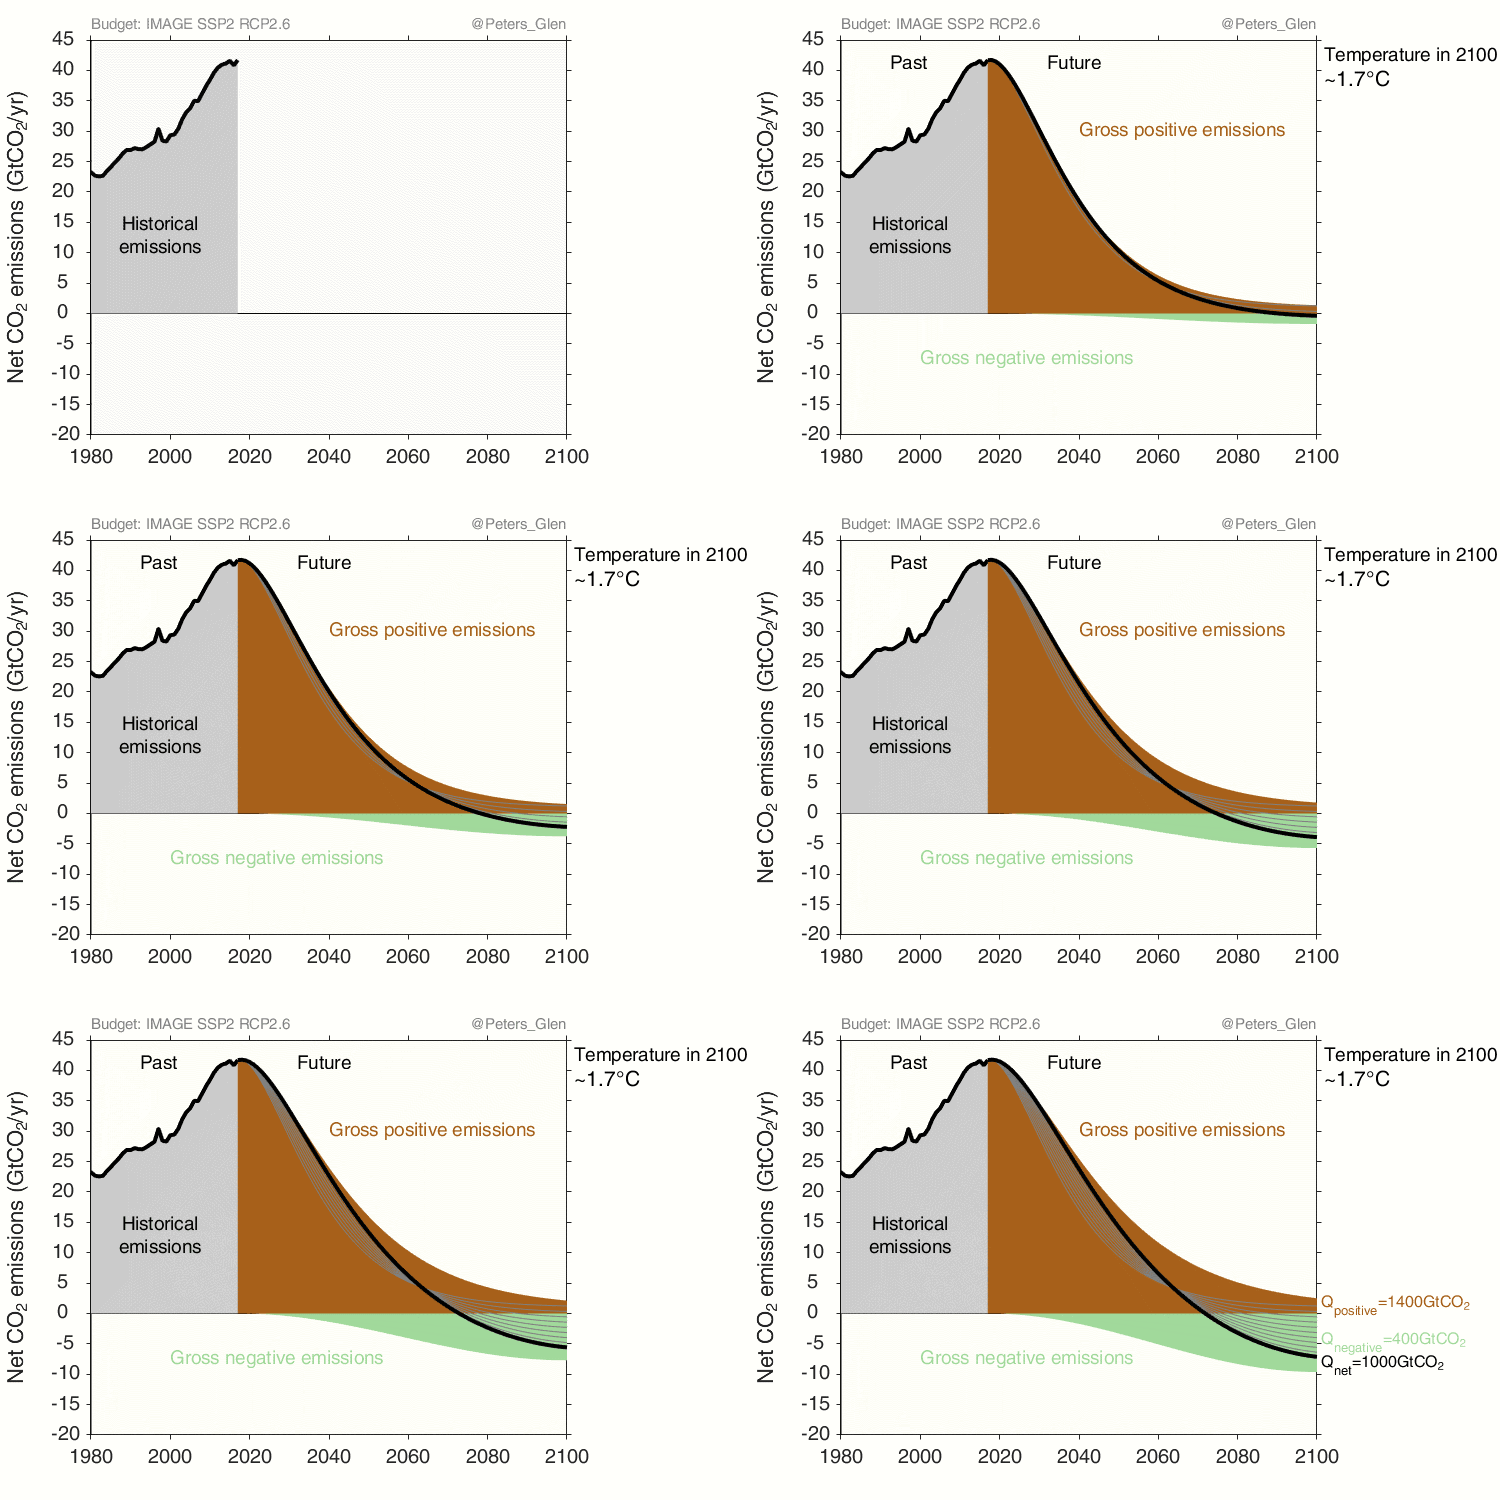
This gif chart by climate scientist Glen Peters helps visualize the need for gigaton-scale negative emissions technologies. These technologies will be needed just to maintain temperatures 1.5-2.2 degrees C higher than pre-industrial times.
This is because of several factors. There will be hard to abate sectors like aviation, shipping, industrial heat and agricultural methane. Emissions can be underreported and unverified, especially for developing countries. Nationalized entities control three quarters of fossil fuel assets but lack incentives to report when their resources are burned. Negative emissions technologies at scale would also help reverse ocean acidification, per the IPCC 2021 report.
There are some who think that negative emissions tech will create a moral hazard for companies to keep burning fossil fuel and slow down the energy transition.
But this might not be true. We’ve seen how solar, wind and batteries keep getting cheaper and better. That has driven continuing coal and gas plant shutdowns and will begin reducing demand for oil.
Incentives will likely play a bigger role than negative emissions tech in fossil industry decision-making. Coal mines are being decommissioned at a historic pace as over 80% of new installed electricity capacity is from renewables and largely solar and wind. Financing for fossil fuels is becoming increasingly difficult, even in developing countries like Vietnam.
Overall, there is a strong economic and climate mitigation case to make progress on negative emissions technologies and to start scaling now.
5.2 Direct Air Capture Is A Promising Approach
We need to try a thousand approaches to removing CO2. Soil carbon, regenerative agriculture, macro algae, biochar, geologic weathering, biomass conversion and obviously reforesting and planting more trees. But technology could well be the fastest way to scale carbon removal to multi-gigatons per year.
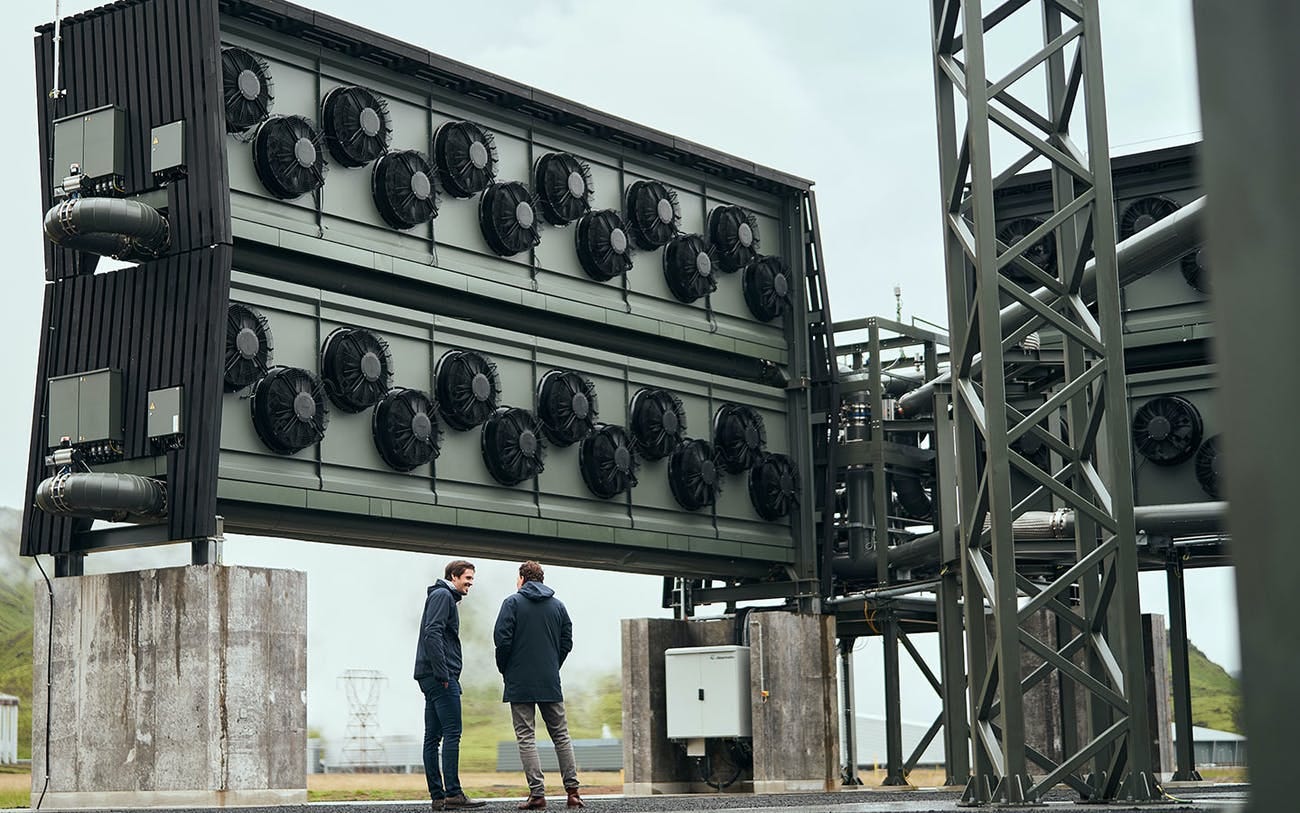
Direct air capture (DAC) broadly is a group of chemical technologies that remove CO2 from the atmosphere directly. Even 12 years ago, filtering CO2 molecules that comprise over 400ppm (0.04%) in the atmosphere sounded expensive and impractical to all but a few scientists like Klaus Lackner, a pioneer in this space.
Yet 25 years ago, very few would have believed that in 2021 there would be roughly enough electrons globally harnessed from solar and wind plants to power the EU. Or that EVs would already outsell ICE cars in Norway, and within a few years, China and most of Europe. Just as solar and batteries, some types of DAC technologies are well suited for high learning rates as capacity scales.
Another benefit of DACs is the relatively low land requirements they have. A World Resources Institute report in 2021, coauthored by Noah McQueen, estimated that capturing the same amount of CO2 per year would require 40-2000 times less land than reforestation. Of course, there are other valuable reasons to reforest as well. Further, capturing 1 GT per year would require a parcel of land between 20-157 km on all sides (12.5-98 miles) but this would be distributed across capture sites.
The following simplified diagram shows a DAC capture process and sequestration or utilization. Most current DAC startups capture CO2 using a contactor (basically a filter) made from a solid sorbent or liquid solvent. The contactor allows other molecules in the air, primarily nitrogen and oxygen but binds CO2. Then using heat, pressure, moisture, electrochemical or other methods, the contactor releases the CO2. The result is a gas, usually of high purity, which can be compressed and transported.
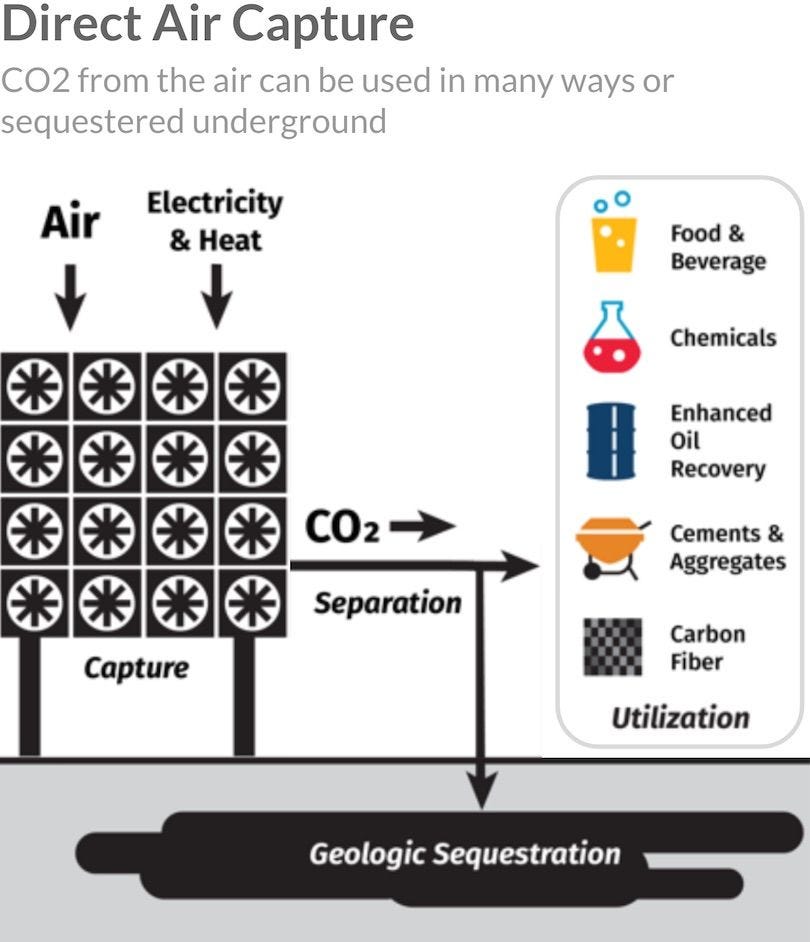
Climeworks launched the DAC industry in 2009, having been started by two ETH researchers in Switzerland. Twelve years later, the industry has not yet seen any substantial traction.
Climeworks just launched Orca in Iceland, their DAC plant that can remove 4000 ton of CO2 per year, which is then mineralized into rocks underground by Carbfix. Carbon Engineering, or SeaChange's process to produce limestone in the ocean. the leading liquid solvent startup, plans to start operating their megaton-scale plant in 2024.
One of the problems with existing approaches for leading DAC startups like Climeworks is the heat required. This can drive up operating costs and requires a source of heat nearby, even if it is low grade meaning less than 100 degrees C. Carbon Engineering requires a significant amount of natural gas as an input, which is also problematic.
Electrochemical DAC Could Be Cheap and Scalable
Taking an electrochemical approach to release CO2 from the contactor would not require any energy other than electricity. This would lower operating costs as solar and wind generated electricity prices keep falling.
DAC startups applying electrochemistry include UK based Mission Zero. They claim the lowest DAC energy consumption in producing CO2 at $275/ton today, the cheapest quoted price amongst any player. Mission Zero also claims they can produce CO2 for less than $100 or even $50/ton within a decade. To hit $100/ton, they may require scaling to only 500 tons of CO2 removal per year, which is one to three orders of magnitude less scale compared to what their non-electrochemical competitors are aiming for. They are one of the startups Stripe has committed to purchase CO2 from.
Another startup leveraging electrons to capture carbon is Bay Area based Prometheus Fuels. They’re the first carbon capture company to reach unicorn status, and within only 2.5 years of launch. They use a different electrochemical process to separate the CO2 to make cost effective low carbon fuels that have led to BMW and Maersk, the shipping giant, investing in them. Net-zero carbon-based fuels are especially compelling for shipping vs say hydrogen, which would need to be converted to ammonia to compete on energy density vs so called “electrofuels”.
It is very early days for electrochemical DAC — Mission Zero’s technology is at lab scale for now. Despite that, it is a very promising approach for carbon removal. I think today, many are underestimating the rapid scalability and cost reductions possible with electrochemical processes.
Passive Air Flow DAC
Using passive air flow instead of fans is another way to minimize energy requirements and simplify designs.
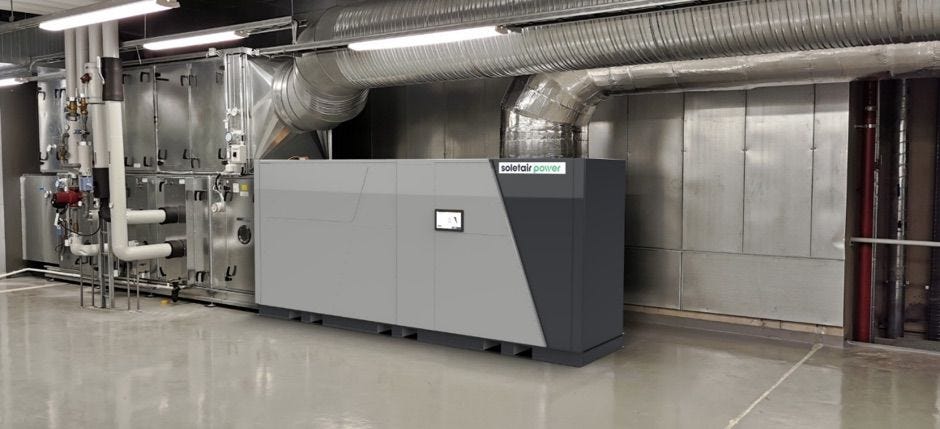
One way to do this is to integrate DAC into HVAC units or ducts inside buildings. The first startup in the world doing this is Soletair Power. They have a product that integrates with a building’s HVAC unit (pictured), and another that is a smaller unit for use in meeting rooms. A benefit of this method is reducing “stuffiness” inside buildings due to high CO2 concentrations, which can improve cognitive function. Soletair is selling their capture units themselves as valuable products, in addition to combining the CO2 produced with green hydrogen to make clean fuels.
As with most other emerging industries, distribution will be key to company success. As we’ve talked about throughout this post, energy startups (and entire transitions) generally scale up by getting traction in niche markets, then expanding into increasingly larger markets.
5.3 Clean CO2 to “X” May Outcompete Fossil Fuels
Right now, the cost of CO2 from DAC is prohibitive for most markets.
Scaling electrochemical DAC units that are modular, small, cheap to make and powered by clean electrons is likely the easiest and fastest way to bring down carbon costs.
If this can be sustained, atmospheric CO2 will become a cost-effective input into making fuels, plastics and many other carbon-based industries. Just as with the rapid learning rates for solar and batteries, falling costs and higher deployments can expand addressable markets as shown in the figure below.
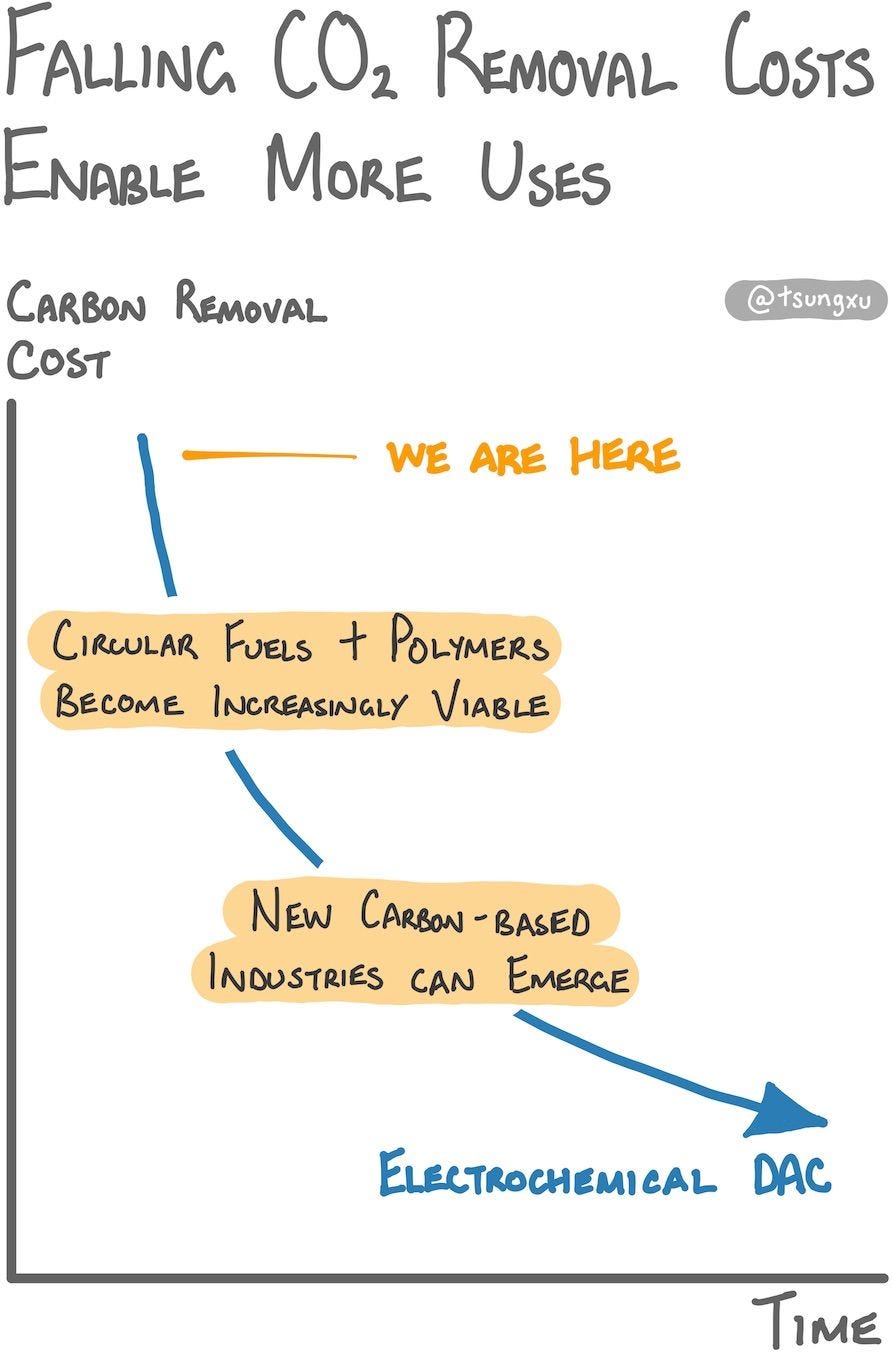
Which markets have the most potential to scale up DAC and electrochemical DAC in particular? There are two broad types of markets that startups are currently trying to sell into.
CO2 sequestration or mineralization. One is to earn carbon removal credits to sequester the CO2 underground or mineralize in rocks for thousands of years. Heirloom and Parallel Carbon among others are focused on this group of approaches, whilst 44.01 and Carbfix store the captured CO2 underground.
Right now only a handful of companies like Stripe, Microsoft, Shopify and Swiss Re are purchasing credits. The cost of CO2 removed from DAC is still high for now compared to nature-based carbon removal. Startups pursuing this path see permanent carbon removal (hundreds or thousands of years) as the largest market. They are targeting these early-adopter corporate buyers and seek to leverage government policies like the US-based 45Q tax credit.
CO2 utilization. The other type of market for CO2 is making things that are economic to sell. We will dive more into these markets. There already are existing so-called CO2 merchant markets, and promising growth markets for turning CO2 into other chemicals, fuels and much more.
To get traction and move down the learning curve, CO2 utilization startups are selling into a variety of markets. As we’ve discussed with solar and LIBs, scaling up in an increasing number of markets will drive the cost reductions and performance improvements over time.
5.4 Existing Markets: CO2 As End Product
Food and beverages. In the US, there’s over $450M annually in merchant CO2 sales for food and beverages. CO2 purity requirements (and prices) are higher for food and beverages, which makes it more appealing as an early niche to go after. For larger breweries, prices of $200/ton are possible when there’s no shortage. Purchasing smaller volumes means paying up to ~$3000-$4000/ton. This high cost is largely due to transporting CO2 hundreds of miles. Roughly two thirds of US CO2 made today is a byproduct of ethanol or ammonia plants located far away from the point of use.
Startup Noya had been targeting this market for their distributed DAC units. They integrate air capture into cooling towers on building rooftops, selling to local breweries and other food and bev customers. This allows them to save on transport and handling costs. They have only deployed one DAC unit at time of writing, but have hundreds of potential customers lined up.
CO2 refrigerants. Refrigerants are the substances used in refrigerators of all sizes, and the market was worth $2.7B in 2021 in the US alone. A problem with existing refrigerants like HFCs is their high climate warming potential, which is three orders of magnitude more than CO2. Recent legislation changes in California and other regions around the world will provide tailwinds, requiring using refrigerants with less warming potential. CO2 (aka refrigerant R744) is increasingly being used in some applications like grocery stores. Some startups are even selling more efficient solid-state chip cooling systems using CO2.
5.5 Emerging Markets: CO2 As Input Material or Additive
More and more startups are using electrochemical processes, like the one in this diagram, to turn CO2 into useful chemicals. Twelve turns CO2 into CO for conversion into various chemicals, fuels and plastics. Mars Materials is using CO to produce an intermediary chemical that is turned into carbon fiber. As mentioned earlier, a startup has secured hundreds of millions in funding to turn CO2 to fuels using an electrochemical process.
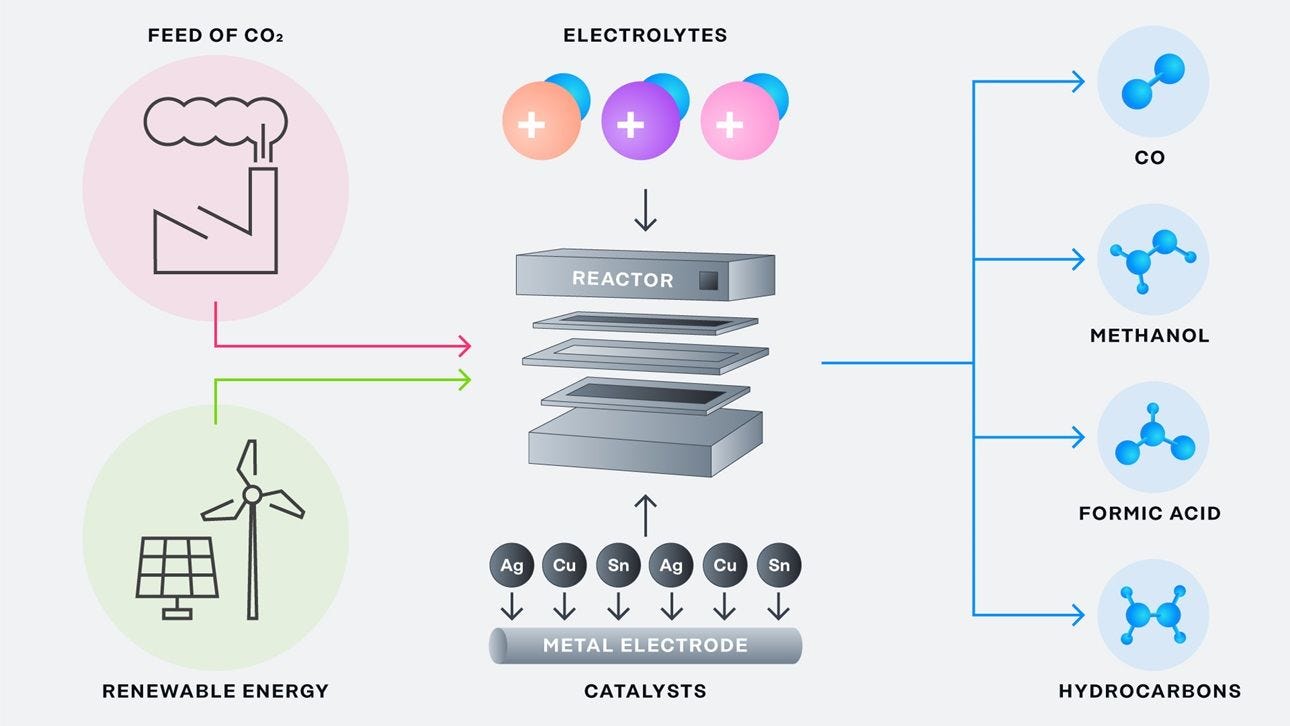
CO2 is already being used to make high grade diamonds. Startups do this by turning the molecules into hydrocarbons, then into the gems. Of course, given the prices of diamonds, the cost and effectiveness of the process is not as important. It is also increasingly being added to concrete or building aggregates, often improving material attributes.
Other emerging carbon utilization pathways use biochemical processes to convert CO2 (or biomass like corn) into valuable goods. Solugen, a Houston-based startup that became a unicorn in five years, synthesizes chemicals using a carbon-negative process from corn, air and water. They are already producing petro-free chemicals at, or below, incumbent costs. Lanzatech uses a microbial fermentation process to turn a source of carbon monoxide into fuels, plastic bottles and more. Other startups are exploring pathways to using CO2-derived formic acid to produce chemicals using synthetic biology.
Air Protein feeds a specific type of microbe CO2, that can be converted into protein-rich meat alternatives.25 The microbes are fed nutrients and renewable electricity, producing a carbon-negative protein-rich flour that is then refined into protein.
Falling renewable and CO2 removal costs will help make these carbon utilization pathways increasingly viable for larger markets.
I think we are in the very early days of CO2 utilization, with huge potential to turn the 2.4 trillion tons of prehistoric plant matter in the atmosphere26 into things we use everyday.
5.6 Circular Is Nearly As Good As Permanent
We need permanent storage of CO2, and policy incentives like the 45Q tax credit, California’s LCFS and others will help. There may be enough corporations willing to purchase CO2 removal credits in addition to early adopters like Stripe, Microsoft, Shopify and Swiss Re to create a sustainable long-term market for permanent removal.
But I also think CO2 which is less permanently stored is a huge opportunity. Turning CO2 into fuels, chemicals, plastic bottles and more will also help bring down net emissions. Polymers last for years or decades and many can be recycled. Building materials like concrete can last for hundreds of years and are very unlikely to be re-released into the air.
As the CO2 utilization market grows, the amount re-emitted from “waste” CO2-made goods should become insignificant compared to how much we can capture and use. Electrochemical DAC can be a driving force for a low-cost and viable circular economy.
Also, as DAC deployments rise, CO2 costs keep falling and enable use in more applications. CO2 removed at less than $100/ton becomes a commodity, comparable to the price of bulk concrete ($125/ton average in US), and iron ore ($75-$200/ton). These are obviously not directly comparable, but are useful anchors for thinking about the usefulness of billions of tons of captured CO2 per year.
Throughout history, using carbon has been essential. From using wood for heat to fossil fuels and polymers, we have gained more control over harnessing carbon. In the 20th century we learnt how to manipulate carbon-based molecules to create synthetic materials. It seems likely that CO2 from the air could be the next phase of a more balanced relationship with carbon.
It has (tera)tons of potential.

6 Opportunity: Emerging Materials
It would be very surprising if there were no new commercialized materials resulting from the clean energy transition.
As discussed in the Past Transitions section, each energy transition has played a crucial role in unlocking new materials. Each transition is like walking into another room with a closed door. You know the room you are walking into will look and be very different, and in many ways, better. You just don’t know exactly what will change.
Each transition has enabled massive improvements to existing materials (wrought iron and later steel made using coal), created entirely new materials (polymers from oil-refined petrochemicals) and/or made low-cost manufacturing viable at scale (aluminum using electricity).
I think graphene and other 2D materials are strong candidates for emerging materials. Biomanufactured materials are also interesting. We’ll come back to the case for graphene and the current and potential applications.
But to first present a case by analog, let’s briefly look at the rise of low-cost electricity that helped aluminum production scale up. Having a reference point should help put emerging materials into perspective.
6.1 Low-cost Electricity Allowed Aluminum To Scale
Aluminum was only isolated for the first time in the 1820s, as it is only found as a very stable oxide (bonded with oxygen) in nature.
Before electrolysis, the lightweight metal was very expensive to produce at any scale from aluminum oxide. In 1852, it cost $545 per pound, or $1200 per kg to produce. This was almost double what gold cost at the time.
Despite this it attracted a lot of hype. Charles Dickens, Jules Verne and others envisioned future uses. After much R&D by many chemists and tinkerers as well as funding, including by Napoleon III, a new process reduced the price to $8 per pound or $17.6/kg in 1885. This made the price comparable to silver. Everything accelerated from then.
The discovery of the Hall-Heroult process only a year later allowed for electrochemical manufacture of aluminum. By the early 1890s, the process’s commercialization had made aluminum even cheaper. It was $2 per pound ($4.4/kg) in 1890 and a mere $0.5 per pound ($1.1/kg) by 1894.
In forty years, the cost of aluminum had come down three orders of magnitude.27
Importantly, non-electrolytic processes had produced higher purity aluminum up until then. But within 5 years of the patents of both Hall and Heroult, electrolysis trumped them in purity too. Alcoa’s Niagara Falls plant opened in 1895 leveraging cheap electrons from the largest hydropower plant at the time. Many other aluminum plants using electrolysis also started production around then.
Driven by the cost declines, global production skyrocketed over 34x during the 1890s — from 175 tons in 1890 to over 6000 tons in 1899. The fall in cost as production ramped is similar to what we've been discussing for solar and wind, but in this case for a material, as illustrated here.
The Wright Brothers used an aluminum/copper alloy engine in their first flight in 1903, at a time when aluminum foil and cookware became available. Frames for WW1 airplanes helped drive demand, and later freight trains in the 1930s and the fuselages of planes from WW2 onwards were made out of the light but strong metal.
Today, a key driver for aluminum production is still electricity cost, just like crypto mining and other electron-hungry industries. Alcoa has been closing factories in the US and opening them next to currently cheap electron sources like hydropower in Iceland, Canada and Norway.
What’s clear from the early history of aluminum is that falling prices and scalable processes enabled rapid adoption by more markets. Also, the hype in the 1850s preceded the actual product-market fit starting the 1890s.
Low cost and scalable production were vital for the growth of solar PV and lithium-ion battery tech. I outlined above why I think it will be just as important for CO2 utilization.
I believe this will also be true for promising materials like graphene.
6.2 Graphene: Potential In Many Markets
Has there ever been a Nobel Prize won with a simpler tool than Scotch tape?
This humble tape was what the pioneers of graphene, Andre Geim and Konstantin Novoselov, used in 2004 to first isolate it by peeling off flakes from a chunk of graphite. They would win the Nobel Prize in Physics only six years later.28
Graphene is a single layer of graphite, the most stable form of pure carbon found in nature. When rolled up, a sheet becomes a carbon nanotube. Less than 20 years ago, researchers thought that single-layer materials could not even exist. Now, because of a range of useful properties, graphene could be well on its way to being used in many things.
Single-layer graphene is extremely thin at 0.33 nanometers. That is, over two million layers could fit into a standard 0.76mm thick credit card. Within that nanoscale layer, carbon atoms are arranged in the flat honeycomb lattice shown above.
Useful properties
Graphene’s potential starts with its properties, though it's worth noting these properties are the theoretical limits. As we'll see below, it is finding some uses in niche markets, but the properties are generally not as exceptional in real world uses.
Pound for pound, it is harder than diamond, but more elastic than rubber. It’s 100x stronger than steel but lighter (i.e. less dense) than aluminum. A hypothetical one meter squared graphene hammock could support about 4kg of weight, enough for a cat to nap on.
It is the best conductor of heat at room temperature — twice that of diamonds — and amongst the best electrical conductors, surpassing all metals. Graphene also has a very high surface/weight ratio as only 6 grams are needed to cover a football field. Finally, its pure form is impermeable — it does not let anything through, not even tiny helium atoms.
Traction in a range of use cases
Given these properties, graphene is already in a wide array of commercial products, though mostly contained to smaller niche markets for now.
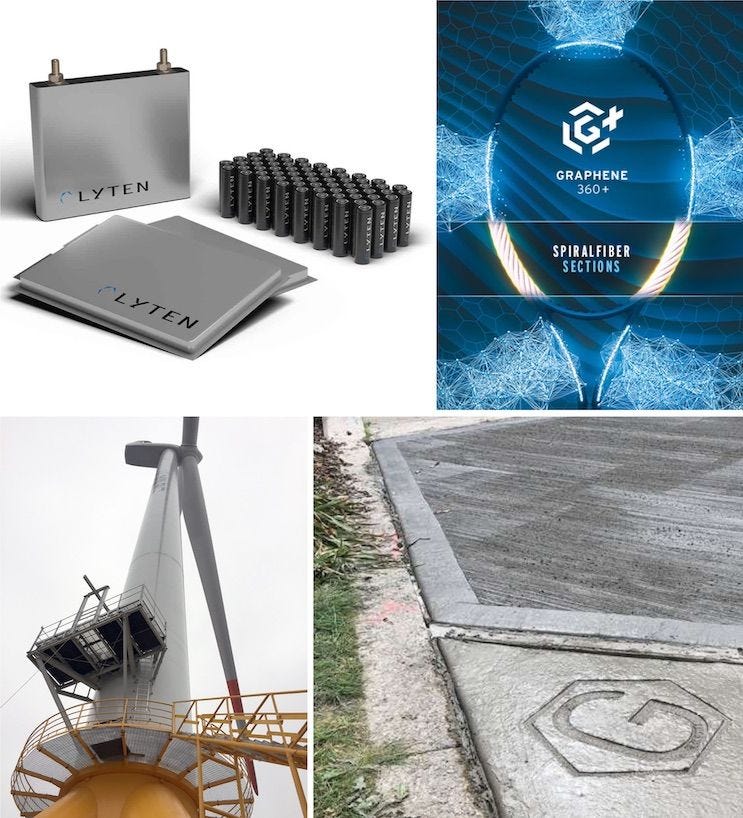
In energy storage, graphene’s ability to dissipate heat has been used by Huawei for smartphone battery heat management since 2016. Some fast-charging power banks recharge phones in as little as 17 minutes using its high electrical conductivity.
Lyten, a lithium-sulfur battery startup employing graphene in the anode for better energy density and faster charging. They are testing their batteries with the US military, aiming for their batteries to enter the EV market in 2026 with up to 3x the energy density of current LIB cells.
Startups like Skeleton Technologies are enhancing supercapacitors with graphene. Skeleton claims to have the best performing supercapacitors in the world, backed up by testing by the US Navy. They use a type of graphene that has a nanoscale 3D structure in their products. Skeleton has a $200M order backlog and has raised €70M so far.
In performance apparel and equipment, graphene has found many high end niche uses. Head offers tennis racquets used by Novak Djokovic, Naomi Osaka and other other elite players which have graphene in the shaft and head.
Vollebak sold a reversible jacket with graphene on one side, that traps heat extremely well and uses graphene’s antibacterial properties. Graphene clothing startups have Kickstarted hundreds of thousands of dollars. Inov8 shoes, used by some of the world’s elite endurance runners, added graphene to some shoe outsoles. More recently, they released soles with graphene-foam that doubled shoe longevity and are more resistant to wear.
Graphene improves performance in other composite materials and coatings too. Leading car wax companies are using graphene in their products for longer lasting paint protection. Graphene-based paints are being used for their protective anti-corrosiveness for ship hulls and offshore wind turbines. Only fractional amounts are needed as additives to concrete to strengthen it by 30%, reducing the amount of concrete (and cost) required.
Graphene also shows promise as a biosensor for medical and healthtech uses. Grapheal has developed a graphene-based 5 minute rapid COVID antigen test that won an innovation award at CES 2022.
Yet problems remain before the graphene market can continue growing. Production has been limited to hard-to-scale processes like chemical vapor deposition. Quality of the material, with many commercial variants, is hard to assess for buyers, and scammers abound.
Electrochemical processes could play a role in bringing down cost of production, and some promising early signs include a flash graphene process that uses energy from electrons to superheat rubber tires or landfill waste partially into graphene that can then be used to strengthen cement.
The overall scaling challenges are likely solvable.
The history of energy transitions and aluminum shows that promising materials will likely find their way into more markets as costs continue to fall.
6.3 Batteries As A Structure
Another interesting emerging material is not exactly a material.
The world will use exponentially more batteries in the next several decades. Why not integrate batteries directly into materials?
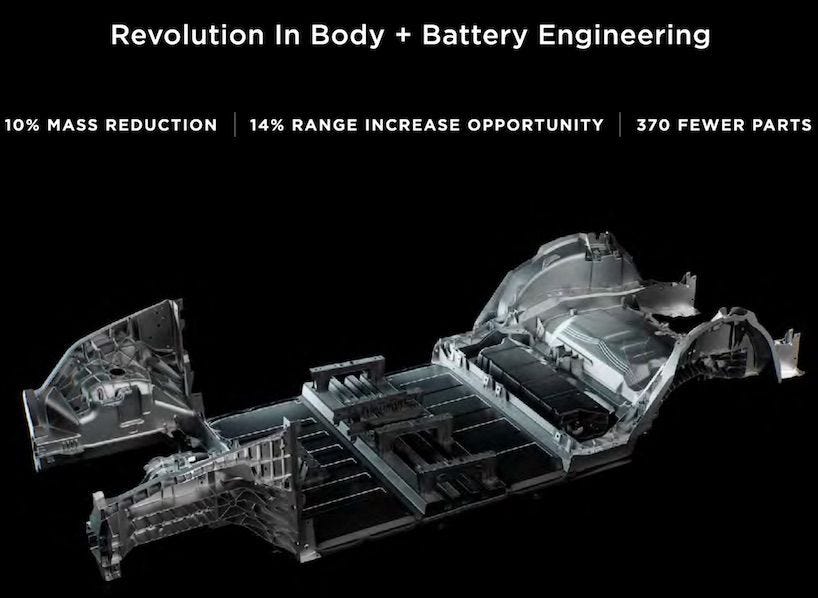
Tesla is developing battery packs that do double work as structural support, reducing mass by 10% and improving range 14%. This allows cost savings by using 370 fewer parts. This hints at the early days of integrating batteries into structural materials.
Researchers, with EU Commission and US Airfare backing, have made breakthroughs in “massless” structural batteries. The lab-scale batteries are made of carbon fiber, aluminum foil and fiberglass. The resulting material is already more stiff than timber, and the researchers think it could match aluminum’s rigidity too.
7 Transition Enablers
The clean energy transition moves fastest when all boats are rowing in the same direction. Startups, R&D, policy, financing and more.
Many things enable the transition, but I will touch on two: AI + software and funding.
7.1 Software and AI Are Key Enablers
Software and AI (including machine learning) are important enablers for the clean energy transition.
Tesla and other EV startups have leveraged their strengths29 in hardware, software and AI to offer features that legacy automakers lack in-house expertise to replicate. Tesla’s camera-based FSD system and custom chips are only possible with a highly skilled team of hardware, AI and software engineers. Software-based realtime traction control has become even more finely tuned with EVs — see Rivian’s torque vectoring as an example.
Computing power used in training AI systems has skyrocketed since a 2012 breakthrough in an image processing algorithm. As shown below, research by Open AI has found it has doubled every mere 3.4 months since then. That’s remarkable, and shows no signs of slowing down. Further, the amount of compute required to train a neural network to the same level of performance on a computer vision benchmark algorithm has halved every 16 months.

In the electricity sector, software is helping to lower friction. Seattle based Level 10 offers a booming marketplace that connects project developers with corporate PPA buyers. Arcadia allows software developers to integrate utility data into their apps — so that people and businesses can plug in to local renewables projects without changing utility.
Real-time software (e.g. Tesla’s Autobidder) allows battery storage plants to monetize and offer electricity services useful to the grid. Distributed energy resources like batteries, solar PVs and energy efficiency devices are being aggregated by Sunrun, Swell, Tesla, Stem and others to monetize participation in the grid.
Patch and Watershed both offer software platforms for companies to remove carbon and track emissions, while Pachama uses AI-powered satellite imagery to track corporate emission reductions.
Meanwhile, machine learning (ML) is increasingly being used to accelerate R&D for materials and chemicals discovery, speeding up time to market. Citrine, Kebotix, Exabyte and more startups are working on this problem. This type of compute is energy-intensive, and enough demand for ML in this domain could help drive demand for clean electrons from solar and wind. Another example is KoBold Metals, which accelerates the exploration of minerals essential for LIBs using AI modeling of mining sites.
Simulating chemical and physical reactions is also a very promising avenue for ML applications. Meta AI partnered with CMU in a project to accelerate the discovery of more effective catalysts to create fuels from renewables. Deepmind, an AI research lab owned by Alphabet, increased wind turbine output by 20% using ML. Their deep learning expertise is also helping a Swiss fusion research group autonomously control the magnetic coils to harness a stable plasma for fusion.
Given the pace of change, I can only hope to have highlighted some aspects of how AI and software are enabling the energy transition.
7.2 The Boom in Climate Tech Funding
Cleantech takes more time, more money, more guts, with longer horizons.
— John Doerr, early investor in Google, Amazon and Cleantech 1.0
Access to plentiful and patient capital is vital for climate tech startups building physical things.
There’s plenty of equity-based funding available, with over $60B invested worldwide in the first half of 2021 as shown below. Around one in seven of total VC dollars are being allocated to climate tech startups and there are now over 78 climate tech unicorns out of a total of less than a thousand unicorns overall.
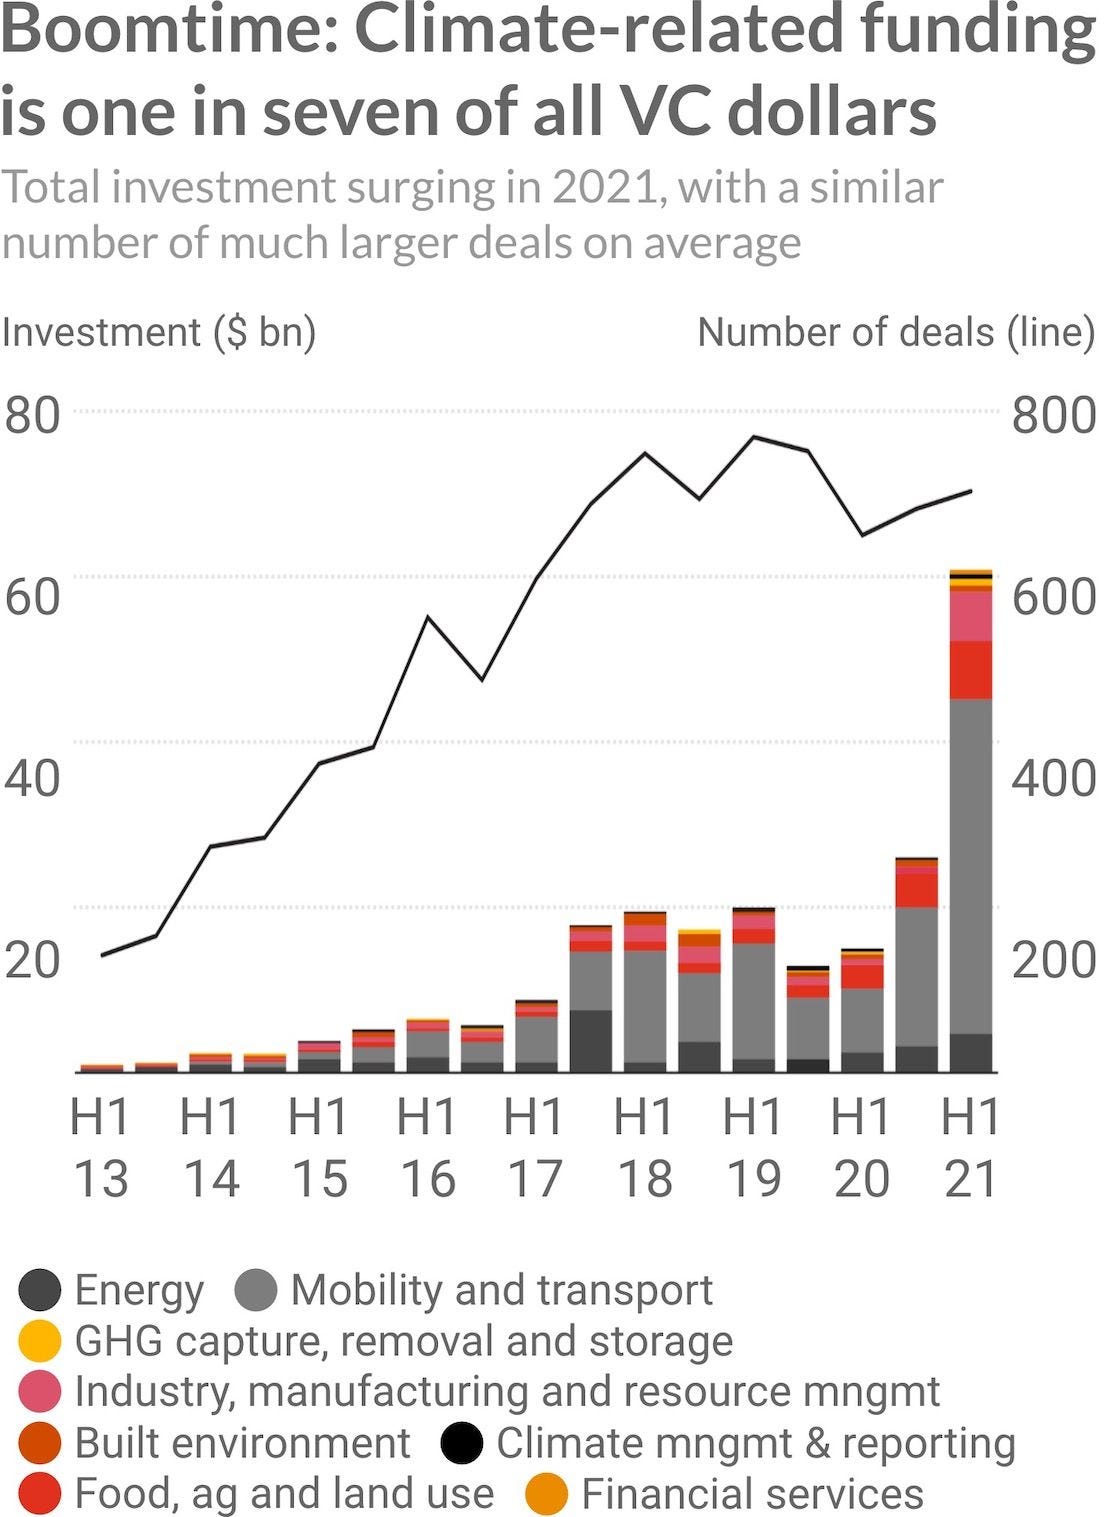
Much of the funding is for mobility and transport startups, no surprise given the stratospheric growth of LIB use in EVs and stationary storage as we discussed. But tellingly, all verticals covered by the PWC report, except for the built environment, grew at over 90% in funding dollars year on year.
Helping startups bridge the gap to a series A are a number of accelerators, incubators and public sector funds and grants available.
VCs have learned to become more patient with climate tech, recognizing that investments in this space require more time for an exit than in internet companies. As we showed with CATL and Tesla’s incredible growth, returns can actually be greater in climate tech vs traditional ones and zeros VC. Indeed, a cleantech investor noted that the supposed bust of Cleantech 1.0 companies does not look as bad in 2021, after just over a decade. Returns on the $25B invested during the entire original boom were about 20x in mid 2021, but would have been underwater back in 2016.
Interestingly, climate tech startups will raise more capital in the first half of 2021 alone than during the entire Cleantech 1.0 “boom”. Also anecdotally, an increasing number of people working in traditional tech (from Silicon Valley in particular) are pivoting into joining or starting climate tech companies.
Debt financing for larger companies is also booming, with over $269B invested in 2020, and 2021 looking like it will grow well beyond that. Parallel to the boom in clean capital, it has become increasingly difficult for fossil fuel incumbents to get access to capital themselves. Banks invested more in green bonds and loans in 2021 than in fossil fuel companies, and new coal plants can’t get financing whilst existing ones are increasingly uneconomic.
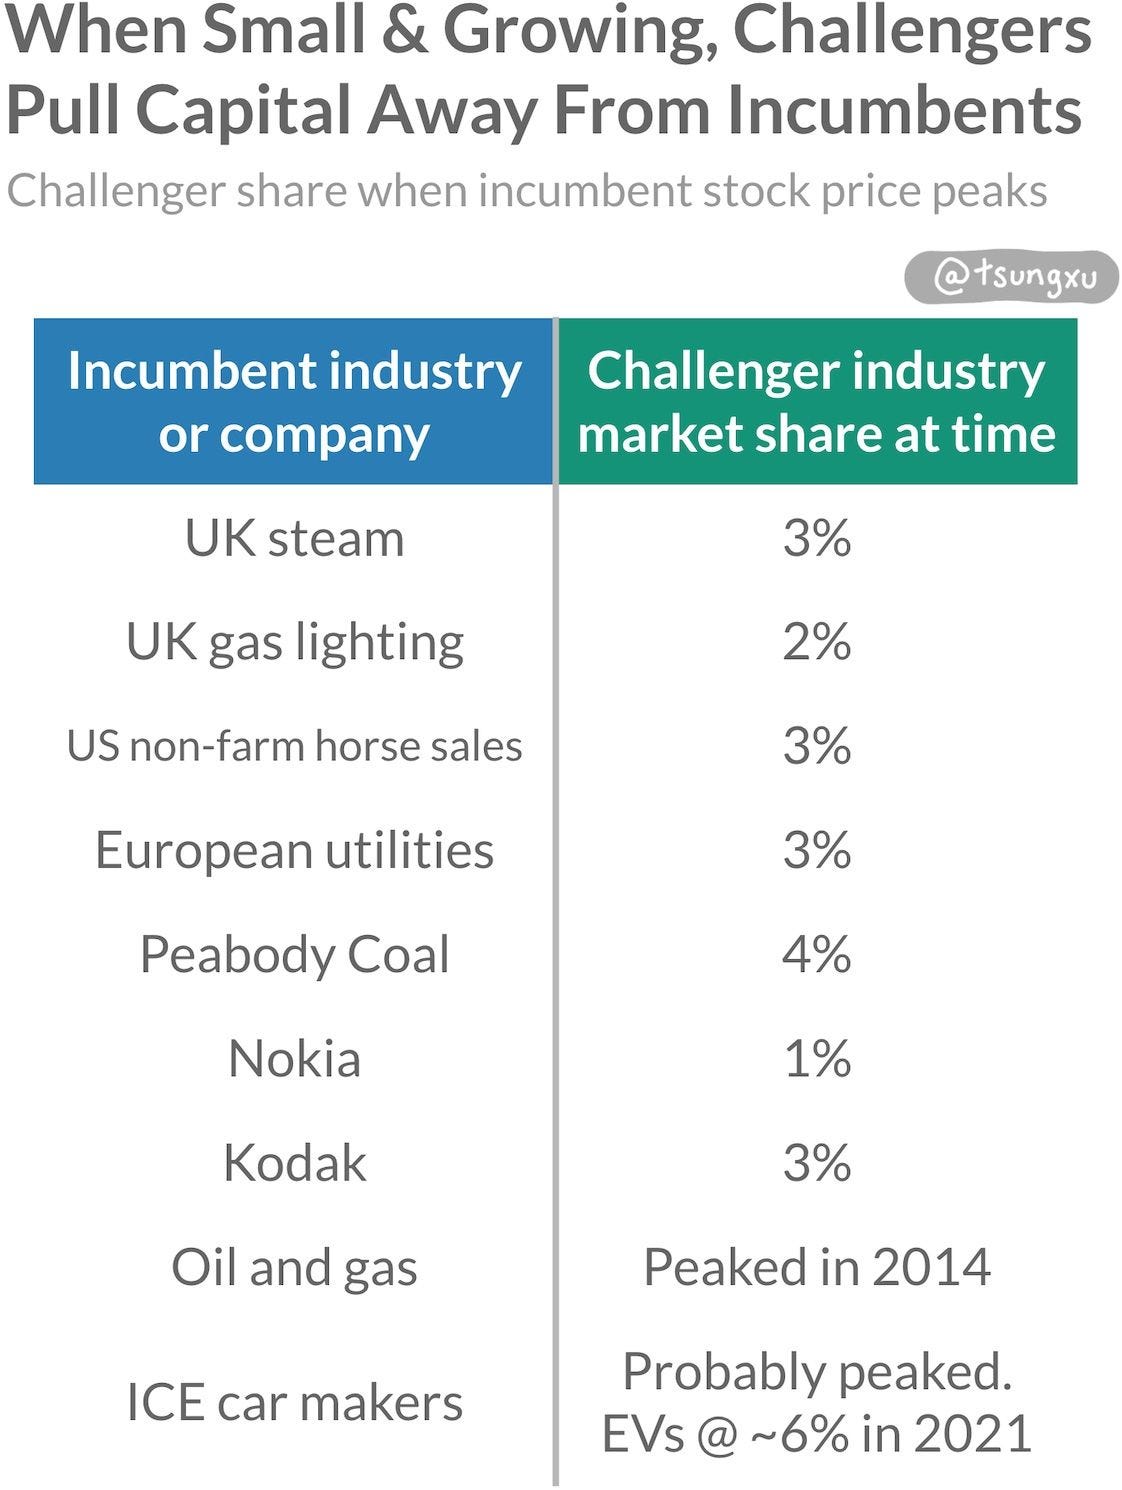
As challengers start hitting accelerated growth, the market share of incumbents start to fall quickly. This is happening for coal right now as solar and wind are sustaining high growth rates, and for ICE cars as EV sales boom.
Finally, the public markets also take notice of market share, as shown in the chart above. Historically, capital tends to desert incumbents when new challengers hold single-digit market share. This sounds surprising, but has played out many times, as shown in this table.
8 A Vision for 2045
There’s not enough optimism in looking forward to better futures.
This surprised me. The problem is massive, but I believe the solutions in progress and that will be developed are up to the challenge. Solar, wind and batteries will decarbonize most of humanity’s energy use and create massive opportunities in new and old industries.
This lack of optimism inspired me to write about possible futures by 2045. I draw a lot on what is written in this post. Go easy on this part as these are visions, and are not predictions!
8.1 Insanely cheap solar, wind and storage power almost everything
In 2045, all electrons are generated from renewables in all wealthier countries, and most middle income ones.
Solar, wind and batteries have made electricity incredibly cheap. Cheap to buy from utilities. Cheap to purchase directly from developers to use in energy-intensive industries. Cheap to buy your own clean energy for resilience. Coal and natural gas plants the world over have retired, unable to compete.
Solar PVs are mounted on most rooftops, and most new roofs have photovoltaics built-in. Many walls and facades also are harnessing energy from photons. Solar plants dot the small amount of land required for supplying most of the grid’s energy needs.
Intermittency has been solved. Wind is harnessed offshore even more so than on gusty plains worldwide. Most large scale solar installations include co-located stationary storage, cheap enough to discharge electrons for 12-24 hours. Scatterings of long duration storage help fill the “Dunkelflaute” weeks that are still and cloudy.
Solar and battery microgrids provide power for countless companies, buildings and remote locations.
8.2 EVs of all types and are taking over transportation
In 2045, EVs are everywhere on land, water and in the skies.
Just like the rapid shift from horses to cars, it is almost impossible to spot an ICE vehicle. EVs are just better — having more range at lower cost and can backup your home in a pinch.
Electric boats glide across harbors and along rivers.
Most vehicles are autonomous, making transport the safest in history. Trucks drive themselves between cities. Cheap, on-demand mobility is now a reality. Traffic and driving speeds in urban areas improve dramatically.
Small eVTOLs have replaced all shorter commercial air routes. People fly from Austin to Houston or London to Paris in less than an hour, and SF to San Jose in minutes. Energy density and material breakthroughs have enabled electric planes with dozens of seats to be cost-effective on longer routes too. People flying from SF to LA, Sydney to Melbourne or Shanghai to Beijing enjoy shorter door-to-door times at lower cost.
8.3 Battery storage is everywhere, but in EVs above all
In 2045, batteries serve as the primary connective tissue for energy. Massive scale storage banks sit alongside equally large solar and wind plants.
Storing even more energy than grid-scale batteries are the scores of LIBs in EVs everywhere. They provide energy to homes, buildings, companies and cities when needed, and vehicle owners are incentivized to share juice. No one worries about battery degradation, thanks to multi-million mile warranties and worry-free range.
8.4 Most existing industries are electrified, all are low-carbon
In 2045, renewable-powered electrification has happened faster than most predicted.
Long haul trips use fuels made using CO2 from the air, transformed into fuels using electrochemistry or biochemistry. These fuels have become cheaper than fossil alternatives. Shipping too, uses cheaper low-carbon fuel from either DAC CO2-derived fuels or clean ammonia from green hydrogen.
Buildings use heat pumps that work even in very cold climates, making gas furnaces obsolete for space heating, just as cheap clean electrons makes water heating with gas uneconomical.
Even industry is electrifying rapidly by 2045. Much steel is produced by cost-effective electrolysis, just as aluminum product-market-fit took off in the 1890s. Concrete is carbon-neutral thanks to CO2 additives. Mines, often remote, have almost all switched from fossils to electron-powered equipment and vehicles. Industrial heat uses a combination of green hydrogen and improved technologies directly converting electricity to heat.
All chemical refining and production is fossil-free, synthesized from the air or microbes and powered by electrons (and heat when needed) from renewables.
8.5 CO2 from the air is a key commodity
In 2045, using carbon is more important than ever. But unlike during the fossil era, it is now clean and cheap, opening up even more ways to use the vast CO2 stock we have in the sky.
Carbon removal has scaled up, slowly at first, then all at once, to multi-gigaton levels. Much of the removal is done using DAC. Electrochemical DAC in particular plays a key role, buoyed by the improving unit economics of clean, cheap electrons. These units are modular and small, mostly deployed near point of use or sequestration to minimize transport time and cost. Car and home air filters have CO2 capture built in, as do HVAC units in buildings of all sizes.
In 2045, captured CO2 from DAC is below $50/ton. Some CO2 has been sequestered underground or mineralized into rocks. But increasingly, it is used as a raw material. CO2 strengthens concrete and replaces the carbon needed for most existing petrochemicals and fuels. It is used to make polymers that were already known, but also new materials that have been commercialized.
We're also putting microbes to work to convert CO2 directly or indirectly in bioreactors. Microbes feast on CO2 from the air to cultivate cell-based meats, seafood and dairy. Pathways using synthetic biology are also being used to produce chemicals, plastics, fuels and performance materials.
Fossil fuels have very few if any competitive uses in making carbon-based products.
Nature-based carbon removal is also working. Regenerative land practices help restore wildlife corridors from barren land. Cultivated kelp forests are revitalizing marine ecosystems.
All of this means that in 2045 we are on the way to reusing the excess 2.4 teratons of CO2 in the air. Still, there’s many decades left before this vast resource will have been put to use.
8.6 Ubiquitous graphene, fusion and more
In 2045, graphene has far outgrown earlier niche markets. It is used in a large range of applications in energy storage, electronics, apparel, medical and high-performance materials.
Indoor air is less stuffy thanks to CO2 filters in HVAC systems. Streets are quieter and cities free of smog.
Indoor and vertical farming are the cheapest way to grow vegetables and berries. Cell-based and plant-derived proteins have almost eliminated the need for animal farming.
Additive and prefab manufacturing are cheaper than conventional construction approaches. Standardized, modular designs will look great, and emerging materials are affordable, clean and perform better than good ol' concrete and steel.
Nuclear fusion tech has advanced enough to be an emerging energy source in 2045, with some plants having enough energy gain to be supplying electricity. It is not yet cost-competitive with solar, wind or batteries but a new generation of founders see paths to get there.
Conclusion
There’s much to be done, but the future is bright.
Congratulations on making it to the end of this incredibly long post!
After deep diving here into the energy transition, I think we can be more optimistic about the future.
In the coming years and decades, we will have access to the cleanest and cheapest energy in history. The biggest opportunities and biggest changes are still ahead. Some of the world's brightest engineers and company builders are working on these as we speak.
Reach me on Twitter, LinkedIn or email me [at] tsungxu [dot] com.
The following founders and engineers at the frontier the energy transition reviewed sections of this article and made them better. Thank you, in no particular order, to Brian Heligman, Duncan Campbell, Jacob Brown, Douglas Onyango, Ryan Anderson, Grant Faber, Shanu Mathew, David Izikowitz and Ivo Stranic. Thanks also to Minh Lam for proofreading and last but certainly not least A-M Delas for being editor-in-chief.
Due to popular demand, you can download a PDF of the article.
Anecdotally, more people are moving into clean energy and climate-related technologies. COVID seems to have helped nudge some people to work in more mission-driven industries. More people seem to realize they can be proud of working on something they are interested in, that can help the world, and be rewarded well for it.
CAGR is the rate of annual growth on average over a period of time, useful for comparing startup or financial metrics like revenue, profitability, etc.
40% CAGR revenue growth for a public company over 10 years is spectacular, for an industry, even more so. Google achieved 25% CAGR revenue growth from 2005 to 2020, and Amazon managed just under 29% in the same period.
I use this term often in this article to show how solar and lithium-ion batteries have grown so quickly for so long.
Solar and wind LCOEs are from Lazard reports from 2010 through 2020. Solar LCOE is for thin-film solar.
I used two measures of US industrial user electricity prices. Pre-1960 data is measured using this Bureau of Labor Statistics historical data series, Chapter S, series 118. Post-1960 data drawn from EIA here.
Prices are adjusted for inflation using FRED’s GDP deflator measure for post-1947 when data became available, and CPI for pre-1947 data points.
I did not include natural gas in these past transitions because it has never reached the impact and share of energy use as coal or oil. It will have an increasingly limited role to play as solar and wind continue to replace it for generating electricity in the 2020s and beyond.
Steel, of course, helped build the modern world. Steel internal structures kicked off a skyscraper boom in Chicago, New York and other large cities throughout the US and Western Europe. Most new ships were made from steel by 1900, with militaries being early-adopters. The massive hull of the Titanic could not have been built without steel.
For more on the role of materials throughout history, take a look at The Substance of Civilization by the late Cornell professor Stephen L. Sass.
Henry Ford had targeted farmers as an early market for the Model T, and had thought farmers could make their own alcohol fuels. This meant the Ford Model T engine was built to use alcohol fuel or gasoline in models for over two decades until 1931. (Rhodes, pg 234-235).
But alcohol fuel was more expensive, and lacked the supply chain that gasoline had, largely thanks to John D. Rockefeller’s Standard Oil. Interesting parallel with lower carbon fuels vs batteries today.
Polyethylene-insulated radar helped win WW2. It allowed British radar equipment to prevent power loss and be light enough to be placed inside their fighter planes.
See Clay Christensen’s classic, The Innovator’s Dilemma, for more on why incumbents struggle to respond to disruptive upstarts.
See note 4 for why I excluded natural gas from this analysis.
Electricity compared with fossil fuels using the substitution method based on conversion factors from BP for post-1965 data and this study for pre-1965 data.
Values for oil and natural gas are lower bounds from conservative calculations. I erred on conservative side for the fossil fuel data points, which have less granular data series, which means the chart shows slightly faster fossil fuel growth than what likely happened. That way, it is very clear solar and wind are scaling up much faster.
See note 9 on how electricity is converted using the substitution method.
The scaling of wind power was similar to solar, but just not quite as fast. From 1983 to 2017, 34 years, the cost of supplying electricity from onshore wind fell by 87% whilst wind energy generated scaled 35,000x.
There’s often this narrative claimed, by some VCs and founders, that the state should take a laissez-faire approach to new technologies. This has worked for software industries, but has largely not been the case for significant breakthroughs in hard tech.
The government did not have to choose winning industries per se, but procurement was important. For example the US government purchased more than half of all US semiconductor chips from the late 50s through the mid 60s, primarily for military use and the Space Race.
That and other examples of government tailwinds for lithium—ion batteries in China and solar as outlined here in many countries show that certain government support can be helpful.
Values are LCOE of unsubsidized utility-scale solar and wind power in the US in 2021 from Lazard’s research. Solar prices are for thin-film PV using single axis trackers. Natural gas cost ranges are based on 2021 values.
Derived from Our World in Data tables for solar generation and capacity.
The cost of installing rooftop solar is incredibly cheap in Australia relative to massive utility-scale sites. It is only 15% more expensive to install in $/KW than utility-scale deployments with many thousands or even millions of panels. As a comparison, rooftop solar in the US is 3-4x more expensive than utility scale solar.
For a great intro on how lithium ion batteries work, check out David Robert’s excellent primer.
The Tesla original cofounders, Martin Eberhard and Marc Tarpenning, had actually developed the first e-reader in 1997 and had pitched Jeff Bezos on it, ten years before the first Kindle released. This gave them an intimate understanding of emerging battery technologies. See Brad Stone’s The Everything Store for more.
The electric Rimac Nevera is even faster, being capable of a ridiculous 8.6 second quarter mile, and it is still cheaper than the Bugatti.
The Model 3 had been cheaper until a series of price hikes in 2021. Despite it costing more, expect it to outsell competitors even more in the years ahead.
The Model Y may become the best selling car in the world overall by 2023.
CATL revenues based on earnings data from Reuters and here in CNY. Conversion to USD done using CNY/USD rate at close on the last day of each reporting period.
AWS is included in the chart, as it has been one of the fastest growing category-defining products in the past ten years.
For CATL, Tesla, and XPeng, numbers are from the latest twelve month period at time of posting: Oct 2020 to Sep 2021.
I recommend another David Roberts post for more context on lithium iron phosphate (LFP) vs nickel-based cathodes. Since that was written, even more EV makers are jumping on the LFP bandwagon, not to mention 2 and 3 wheeler makers and stationary storage producers.
If energy density for LFP can keep improving, it’s possible LFP will be the dominant chemistry, at least before better (cheap) cathodes come along.
ERCOT and SPP are independent system operators which ensure reliability of their separate regional grids.
This is an example of cellular protein production that is emerging as a protein and dairy alternative. Being able to adjust so many characteristics, it’s possible proteins of the future will taste far better than those today. Being able to produce this at scale would dramatically reduce land required to feed billions of humans.
Probably best not to think about how we’re always inhaling that 400+ppm fossilized goodness.
This fall is comparable to that of solar since the 1970s and lithium-ion batteries since the late 1990s, as seen by the charts in the respective sections above.
Geim had won the Ig Nobel Prize in 2000, which is given for quirky or trivial scientific achievements. Winning the Nobel later made him the first, and I believe only, person to have won both awards. He won the Ig Nobel for magnetically levitating a frog.
Many LIB and EV leaders in the clean energy transition either have roots in Silicon Valley (Tesla) or a strong R&D presence there (Rivian, Chinese EV startups, etc). These companies have arguably done a better job than any other in integrating an array of engineering disciplines including computer, mechanical, chemical and electrical engineering.
Apple is perhaps the best example of having done this recently from Macs to smartphones.
Whilst these companies increasingly develop capabilities across disciplines, much of Silicon Valley continues to dive into improving the digital world, for example the Metaverse and “Web3”.


